Chart title in Flutter Circular Charts (SfCircularChart)
12 Oct 20235 minutes to read
You can define and customize the chart title using title property of SfCircularChart. The text property of ChartTitle is used to set the text for the title.
Following properties can be used to customize its appearance.
-
backgroundColor- used to change the background color. -
borderColor- used to change the border color. -
borderWidth- used to change the border width. -
textStyle- used to change the text color, size, font family, fontStyle, and font weight. -
color- used to change the color of the text. -
fontFamily- used to change the font family for chart title. -
fontStyle- used to change the font style for the chart title. -
fontSize- used to change the font size for the chart title.
Text Alignment
You can align the title text content horizontally to the near, center or far of the chart using the alignment property of the title.
@override
Widget build(BuildContext context) {
return Scaffold(
body: Center(
child: Container(
child: SfCircularChart(
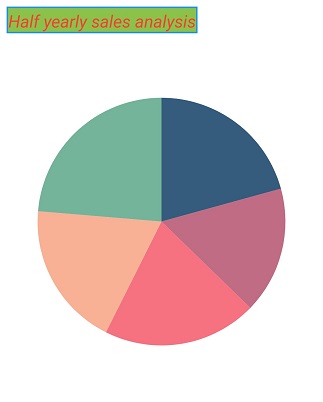
title: ChartTitle(
text: 'Half yearly sales analysis',
backgroundColor: Colors.lightGreen,
borderColor: Colors.blue,
borderWidth: 2,
// Aligns the chart title to left
alignment: ChartAlignment.near,
textStyle: TextStyle(
color: Colors.red,
fontFamily: 'Roboto',
fontStyle: FontStyle.italic,
fontSize: 14,
)
),
series: <CircularSeries>[
// Initialize line series
PieSeries<ChartData, String>(
dataSource: [
// Bind data source
ChartData('Jan', 35),
ChartData('Feb', 28),
ChartData('Mar', 34),
ChartData('Apr', 32),
ChartData('May', 40)
],
pointColorMapper: (ChartData data, _) => data.color,
xValueMapper: (ChartData data, _) => data.x,
yValueMapper: (ChartData data, _) => data.y
)
]
)
)
)
);
}