- Types of Trendline
- Forecasting
- Customization
- Legend Item Visibility
Contact Support
Trendlines in Xamarin.iOS Chart
29 Nov 20224 minutes to read
The Trendline is a line drawn over the chart to display the overall direction of the results. And it built on the assumption based on current and past beliefs.
The following code examples shows how to add Trendline in SFChart.
SFColumnSeries columnSeries = new SFColumnSeries();
columnSeries.Trendlines = new ChartTrendlineCollection();
SFChartTrendline trendline = new SFChartTrendline();
columnSeries.Trendlines.Add(trendline);
Types of Trendline
SFChart support following types of Trendlines.
Linear
Linear trendline was best-fit straight line for simple linear datasets. A linear trend line usually shows that something is increasing or decreasing at a steady rate. This is the default trendline to be drawn for the SFChart.
The following is the code example of linear trendline.
columnSeries.Trendlines = new ChartTrendlineCollection();
SFChartTrendline trendline = new SFChartTrendline();
trendline.Type = ChartTrendlineType.Linear;
columnSeries.Trendlines.Add(trendline);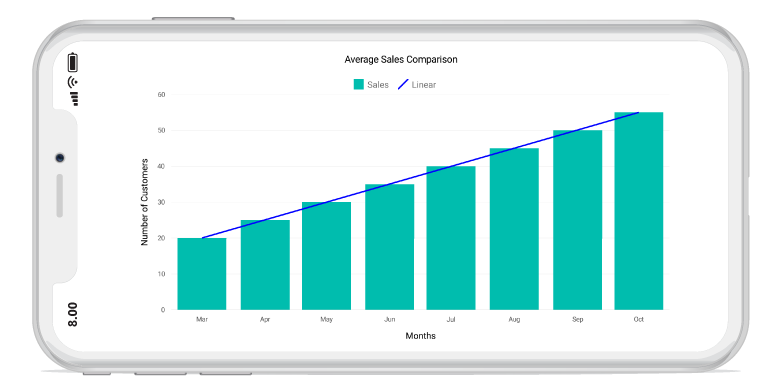
Logarithmic
A Logarithmic trendline is the strongest-fit curved line, that is most effective when the data change rate increases or decreases rapidly. Logarithmic trends may use negative and/or positive values as well.
The following is the code example of logarithmic trendline.
SFColumnSeries columnSeries = new SFColumnSeries();
columnSeries.Trendlines = new ChartTrendlineCollection();
SFChartTrendline trendline = new SFChartTrendline();
trendline.Type = ChartTrendlineType.Logarithmic;
columnSeries.Trendlines.Add(trendline);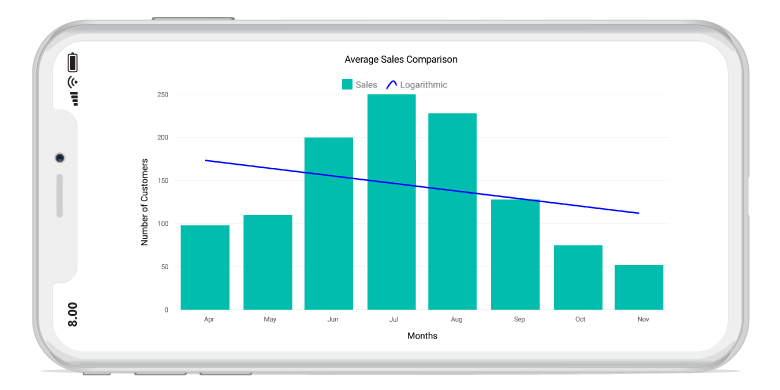
Exponential
The Exponential trendline is the curved line most useful for data values rise or fall at increasingly higher rates.
NOTE
SFChart will not generate Exponential trendline when your data contains zero or negative values.
SFColumnSeries columnSeries = new SFColumnSeries();
columnSeries.Trendlines = new ChartTrendlineCollection();
SFChartTrendline trendline = new SFChartTrendline();
trendline.Type = ChartTrendlineType.Exponential;
columnSeries.Trendlines.Add(trendline);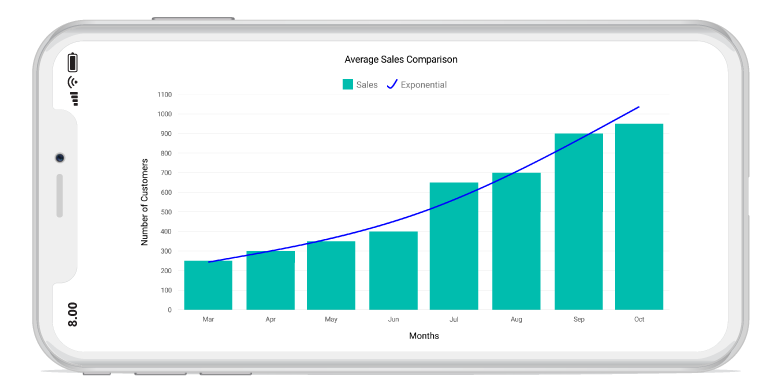
Power
The Power trendline is typically used with data sets to compare measurements that grow at a specific rate.
The following is the code example of power trendline.
SFColumnSeries columnSeries = new SFColumnSeries();
columnSeries.Trendlines = new ChartTrendlineCollection();
SFChartTrendline trendline = new SFChartTrendline();
trendline.Type = ChartTrendlineType.Power;
columnSeries.Trendlines.Add(trendline);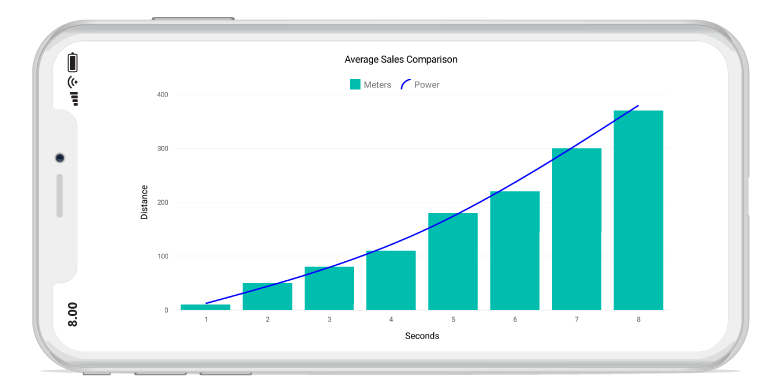
Polynomial
The Polynomial trendline is a curved line that is used when there are more data fluctuations. By default, this trendline calculated with order of 2, it will be override by the property PolynomialOrder.
The following is the code example of polynomial trendline.
columnSeries.Trendlines = new ChartTrendlineCollection();
SFChartTrendline trendline = new SFChartTrendline();
trendline.Type = ChartTrendlineType.Polynomial;
trendline.PolynomialOrder = 3;
columnSeries.Trendlines.Add(trendline);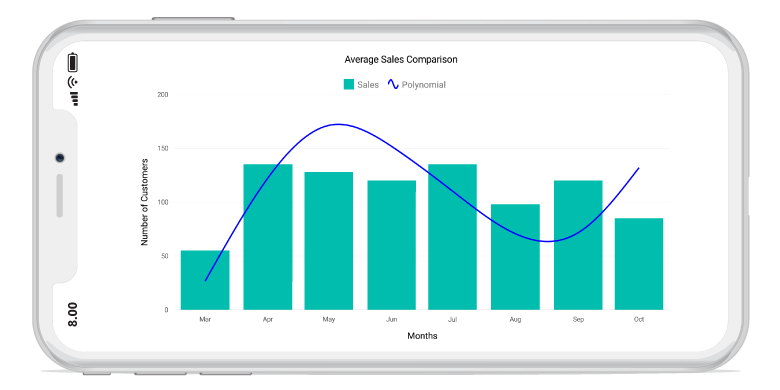
Forecasting
Forecasting is used to display trends about the future and the past beliefs.
The following two types of forecasting are available in SFChart:
- Forward Forecasting
- Backward Forecasting
Forward Forecasting
For determining the future trends (in forward direction). The
following code example explains the how to set the value for ForwardForecast.
columnSeries.Trendlines = new ChartTrendlineCollection();
SFChartTrendline trendline = new SFChartTrendline();
trendline.Type = ChartTrendlineType.Linear;
trendline.ForwardForecast = 2;
columnSeries.Trendlines.Add(trendline);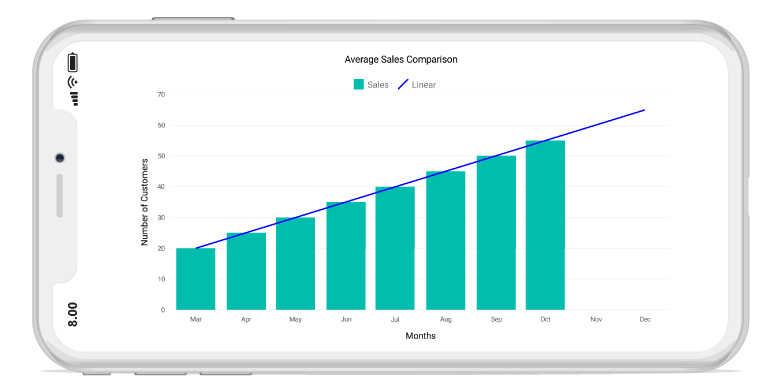
Backward Forecasting
For determining the future trends (in backward direction). The following code example explains the how to set the value for BackwardForecast.
columnSeries.Trendlines = new ChartTrendlineCollection();
SFChartTrendline trendline = new SFChartTrendline();
trendline.Type = ChartTrendlineType.Linear;
trendline.BackwardForecast = 2;
columnSeries.Trendlines.Add(trendline);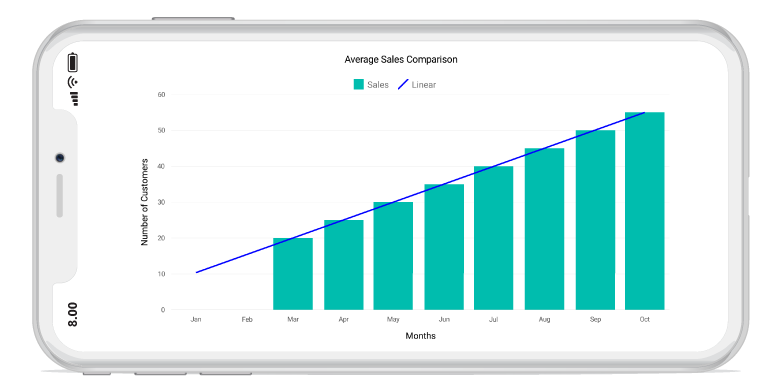
Customization
We can customize the trendline appearance using LineWidth, LineColor and Dashes properties.
trendline.LineColor = UIColor.Black;
trendline.LineWidth = 2;
NSObject[] dashes = new NSObject[2];
dashes[0] = (NSNumber)3;
dashes[1] = (NSNumber)3;
trendline.Dashes = NSArray.FromObjects(dashes);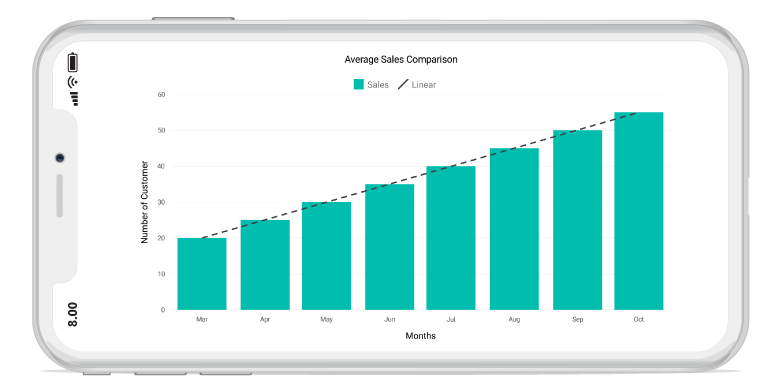
Legend Item Visibility
We can able to control the visibility of the trendline legend items using VisibilityOnLegend property of the Trendline.
trendline.VisibilityOnLegend = true;