How can I help you?
SfChart Series Types
1 Mar 20226 minutes to read
SFSeries is the visual representation of the data. SFChart offers many types of series ranging from line series to financial series like HiLo and Candle. Based on your requirements and specifications, any type of Series can be added for data visualization.
The following APIs are common for the most of the series types:
-
Visible- controls the visibility of the series. -
ItemsSource- used to set the data source for the series. Refer thePopulating Datapage to configure the items source and set the binding paths. -
Color- used to change the color of the series. -
LegendIcon- used to change the icon type in corresponding legend item. -
Label- used to set the label that displays in corresponding legend item. -
IsVisibleOnLegend- used to control the visibility of the series in legend. -
Alpha- used to control the transparency of the series.
Multiple Series
You can add multiple series to Series property of SFChart class. By default, all the series rendered based on the PrimaryAxis and SecondaryAxis of SFChart. But if you want to plot different unit or value that is specific to particular series, you can specify the separate axis for that series using XAxis and YAxis properties of SFSeries.
SFChart chart = new SFChart();
...

SFColumnSeries columnSeries = new SFColumnSeries() {

    ItemsSource = Data,
    XBindingPath = "Country",
    YBindingPath = "Value"

};

SFColumnSeries columnSeries1 = new SFColumnSeries() {

    ItemsSource = Data1,
    XBindingPath = "Country",
    YBindingPath = "Value"

};

SFColumnSeries columnSeries2 = new SFColumnSeries() {

    ItemsSource = Data2,
    XBindingPath = "Country",
    YBindingPath = "Value"

};

chart.Series.Add(columnSeries);

chart.Series.Add(columnSeries1);

chart.Series.Add(columnSeries2);
Combination Series
SFChart allows you to render the combination of different types of series.
SFChart chart = new SFChart();

...

SFColumnSeries columnSeries = new SFColumnSeries() {

    ItemsSource = Data,
    XBindingPath = "Month",
    YBindingPath = "Value"

};

SFLineSeries lineSeries = new SFLineSeries() {

    ItemsSource = Data1,
    XBindingPath = "Month",
    YBindingPath = "Value"

};

chart.Series.Add(columnSeries);

chart.Series.Add(lineSeries);
Limitation of combination chart
- Bar, StackingBar, and StackingBar100 cannot be combined with the other Cartesian type series
- Cartesian type series cannot be combined with accumulation series (pie, doughnut, funnel, and pyramid) and radar & polar series
When the combination of SFCartesianSeries and SFAccumulationSeries types are added to the Series property, the series which are similar to the first series will be rendered and other series will be ignored. Following code snippet illustrates this.
SFChart chart = new SFChart();
...

SFLineSeries lineSeries = new SFLineSeries() {

    ItemsSource = Data,
    XBindingPath = "Month",
    YBindingPath = "Value"

};

SFPieSeries pieSeries = new SFPieSeries() {

    ItemsSource = Data1,
    XBindingPath = "Month",
    YBindingPath = "Value"

};

chart.Series.Add(lineSeries);

chart.Series.Add(pieSeries);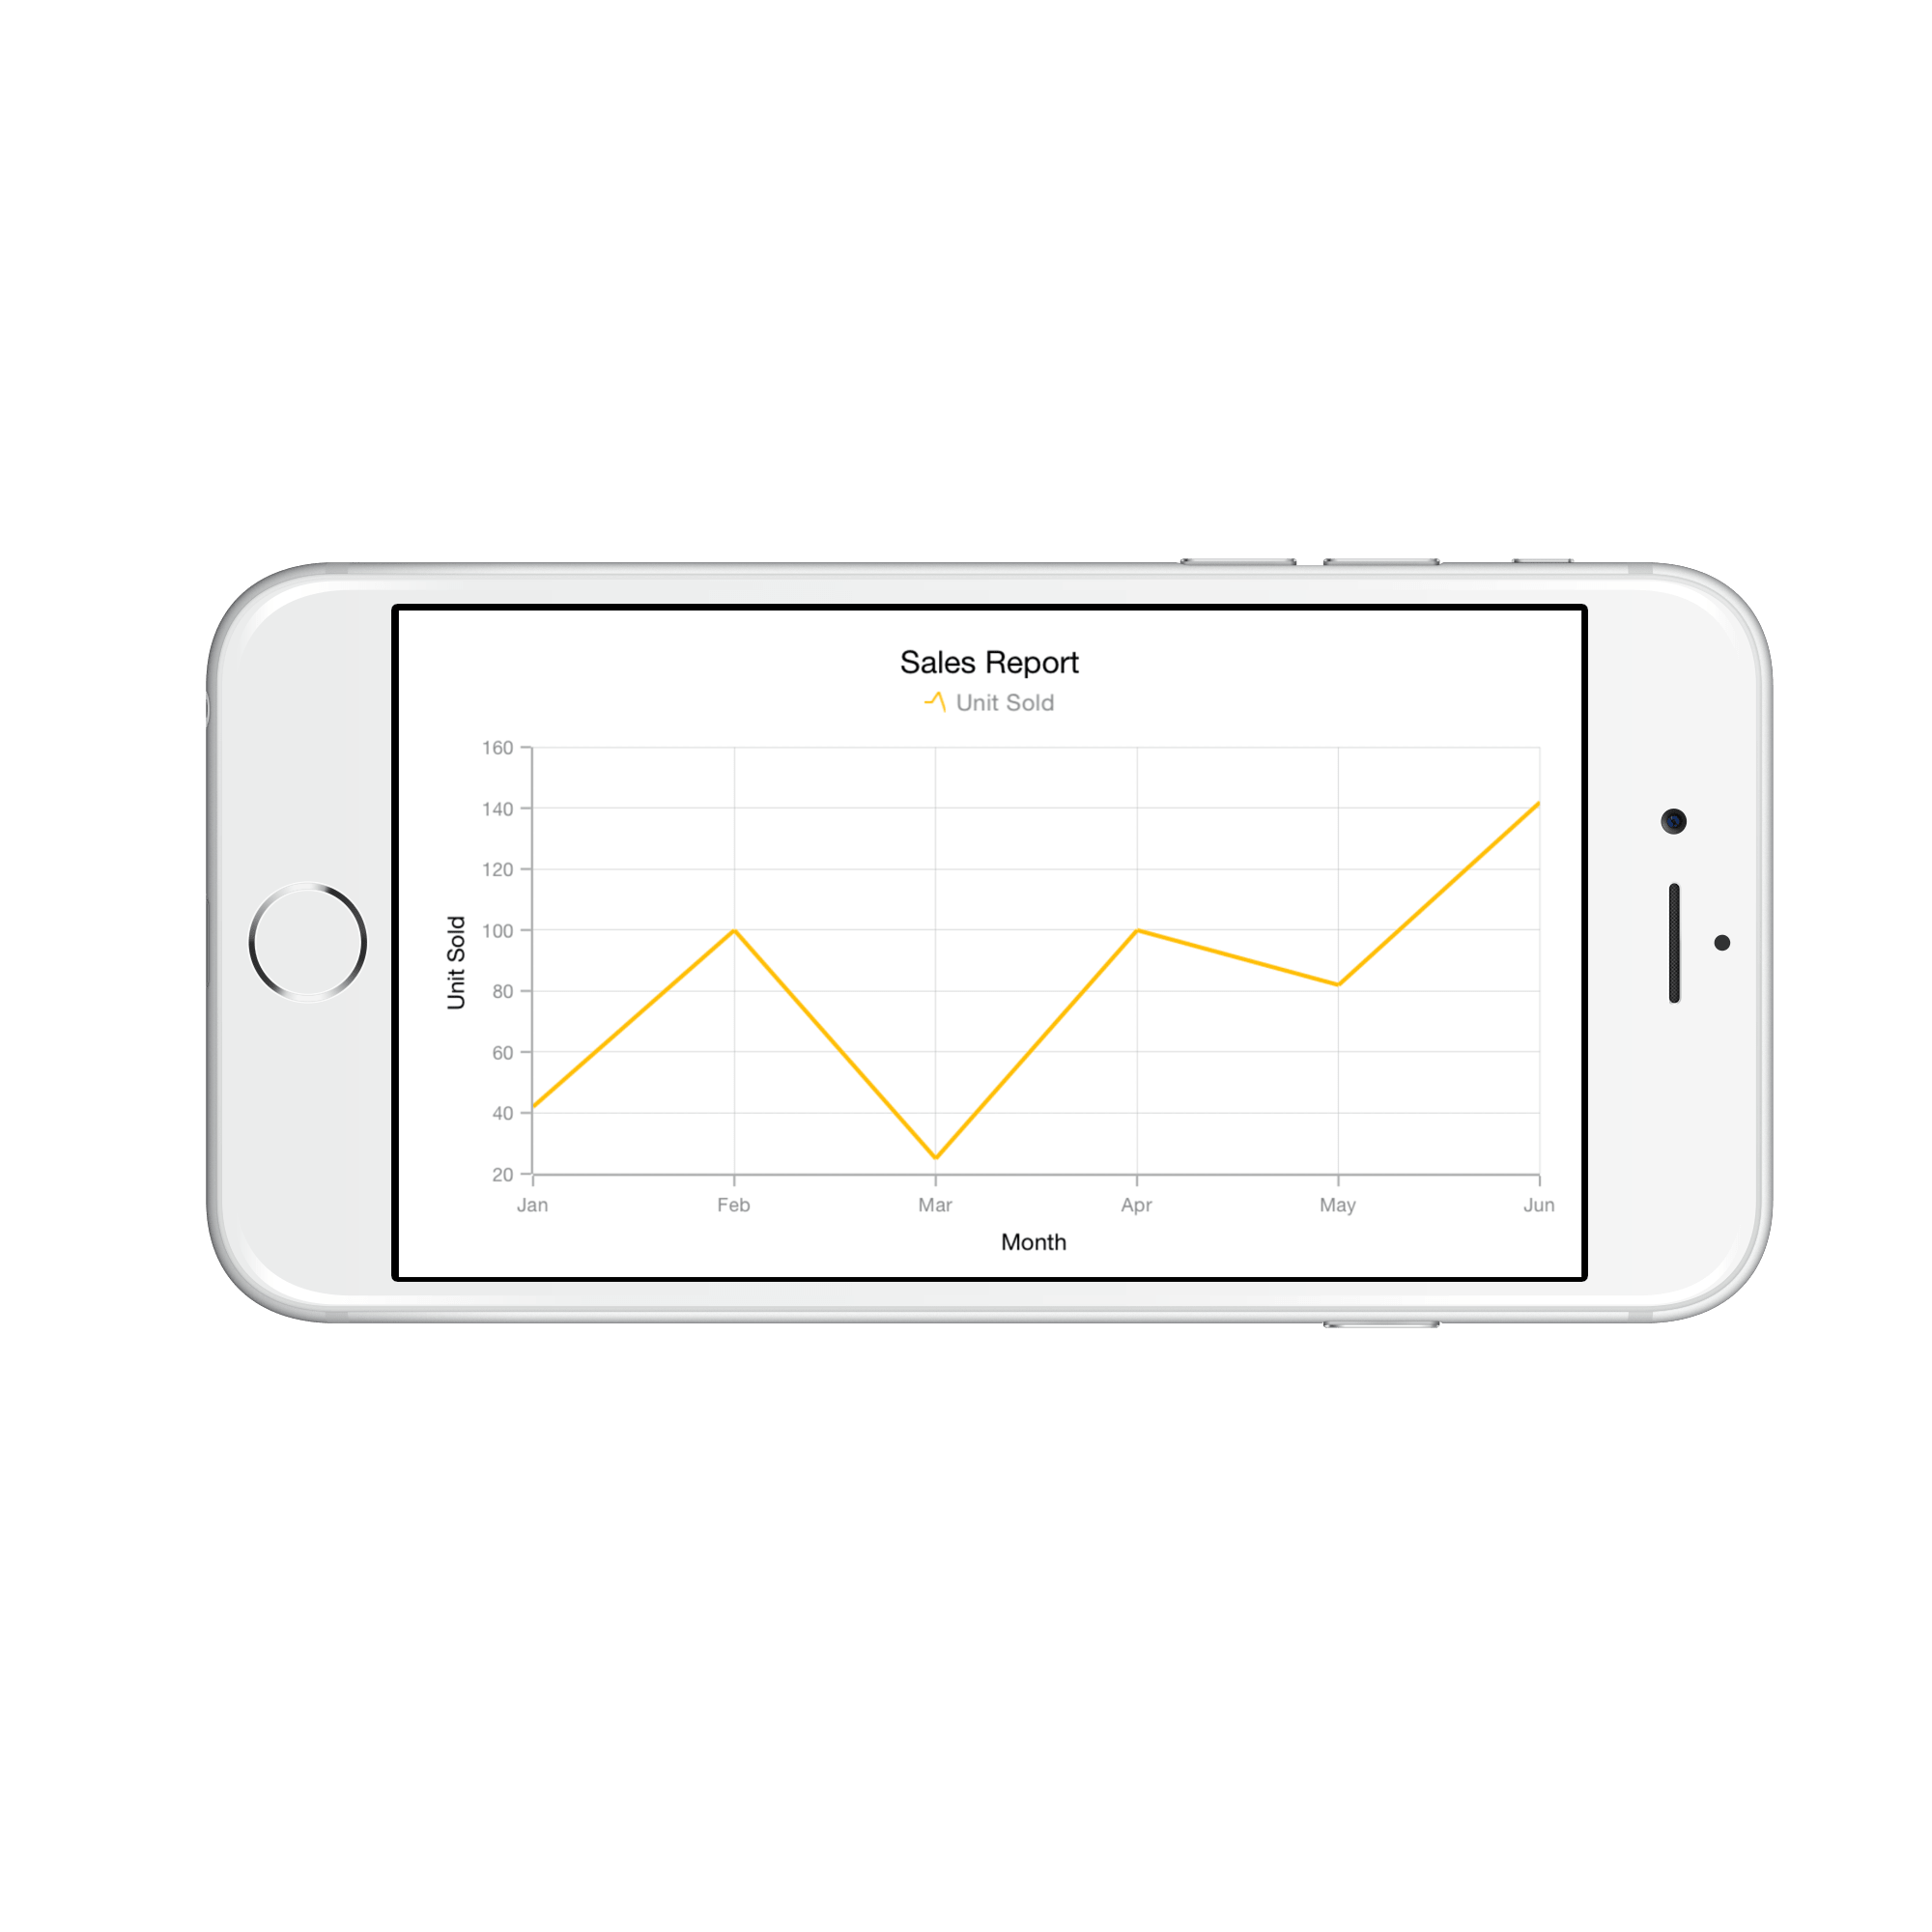
Grouping stacked series
You can group and stack the similar stacked series types using GroupingLabel property of stacked series. The stacked series which contains the same GroupingLabel will be stacked in a single group.
SFChart chart = new SFChart();
...

SFStackingColumnSeries stackingColumnSeries1 = new SFStackingColumnSeries()
{
	ItemsSource = Data1,
	GroupingLabel = "GroupOne",
	Label = "Google",
	XBindingPath = "Month",
	YBindingPath = "Value"
};

SFStackingColumnSeries stackingColumnSeries2 = new SFStackingColumnSeries()
{
	ItemsSource = Data2,
	GroupingLabel = "GroupTwo",
	Label = "Bing",
	XBindingPath = "Month",
	YBindingPath = "Value"
};

SFStackingColumnSeries stackingColumnSeries3 = new SFStackingColumnSeries()
{
	ItemsSource = Data3,
	GroupingLabel = "GroupOne",
	Label = "Yahoo",
	XBindingPath = "Month",
	YBindingPath = "Value"
};

SFStackingColumnSeries stackingColumnSeries4 = new SFStackingColumnSeries()
{
	ItemsSource = Data4,
	GroupingLabel = "GroupTwo",
	Label = "Ask",
	XBindingPath = "Month",
	YBindingPath = "Value"
};

chart.Series.Add(stackingColumnSeries1);
chart.Series.Add(stackingColumnSeries2);
chart.Series.Add(stackingColumnSeries3);
chart.Series.Add(stackingColumnSeries4);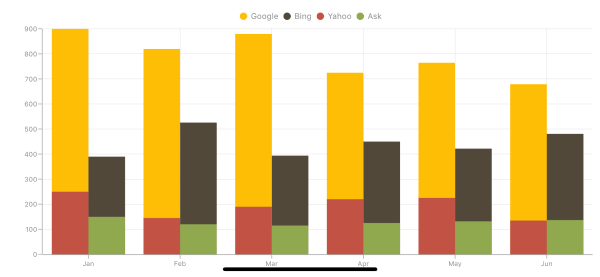
Animation
SFChart provides animation support for series. Series will be animated on loading data points and whenever the items source changes. Animation can be enabled by setting the EnableAnimation property as true and the animation duration can be handled by the AnimationDuration property, which are available in SFSeries.
SFColumnSeries series       = new SFColumnSeries ();
series.EnableAnimation      = true;
series.AnimationDuration    = 0.8;
Transpose the Series (Vertical Chart)
The IsTransposed property of SFCartesianSeries is used to plot the chart vertically and view the data in a different perspective.
SFLineSeries series   = new SFLineSeries ();

series.IsTransposed   = true;
Methods
Following methods are available in SFSeries
-
FindNearestChartPoint(float pointX,float pointY)- used to get the nearest data point for the particular touch point. -
FindNearestChartPoints(float pointX,float pointY)- used to get the list of nearest data points for the particular touch point. -
Animate()- Animate is a built-in method and a short way to play animation on a chart series.