Annotation in Xamarin.iOS Chart
29 Nov 202220 minutes to read
SfChart supports annotations which allows you to mark the specific area of interest in the chart area. You can add text, images, and custom views.
The following annotations are supported in SfChart
- Text annotation
- Shape annotation
- View annotation
Adding Annotations
You can create an instance for any type of annotations and it can be added to Annotations collection. Here for an instance, the EllipseAnnotation is added.
SFChart chart = new SFChart();
...

EllipseAnnotation annotation = new EllipseAnnotation()
{
    X1 = new NSNumber(2),

    Y1 = 35,

    X2 = new NSNumber(6),

    Y2 = 40,

    Text = "Ellipse"
};

chart.Annotations.Add(annotation);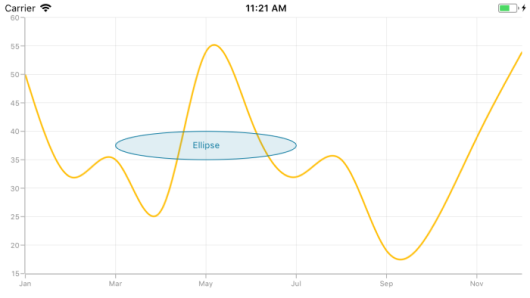
Positioning the annotation
Annotations can be positioned in plot area based on X1 and Y1 properties. For shape annotations, specify X2 and Y2 properties, if needed. The X and Y values can be specified with axis units or pixel units, and these can be identified by using the CoordinateUnit property.
Positioning based on CoordinateUnit as axis
To position the annotation based on axis, set the X1 and Y1, X2 and Y2 properties based on axis range values, if needed, set the CoordinateUnit value as Axis.
SFChart chart = new SFChart();
...

RectangleAnnotation annotation = new RectangleAnnotation()
{
    X1 = new NSNumber(4),

    Y1 = 40,

    X2 = new NSNumber(8),

    Y2 = 45,

    Text = "Axis Value",

    CoordinateUnit = ChartCoordinateUnit.Axis
};

chart.Annotations.Add(annotation);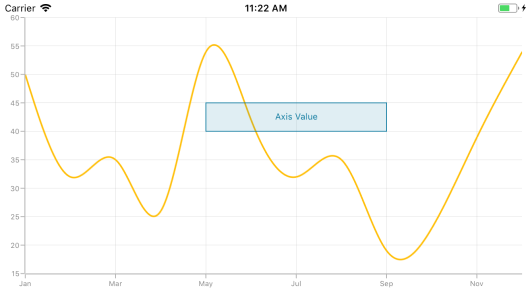
Positioning based on CoordinateUnit as pixels
To position the annotation based on the pixel values, set the CoordinateUnit as Pixels, and the pixel values in X1 and Y1, X2 and Y2 properties of annotation are shown in the below code snippet,
SFChart chart = new SFChart();
...

RectangleAnnotation annotation = new RectangleAnnotation()
{
    X1 = new NSNumber(1),

    Y1 = 1,

    X2 = new NSNumber(150),

    Y2 = 150,

    Text = "Pixels",

    CoordinateUnit = ChartCoordinateUnit.Pixels
};

chart.Annotations.Add(annotation);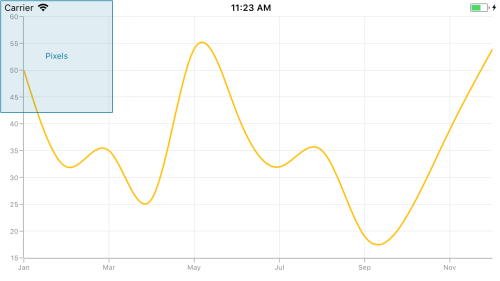
Adding annotation for multiple axes
When there are multiple axes, annotation also can be added for a particular axis by using the XAxisName and YAxisName properties and it is shown in the below code snippet,
SFChart chart = new SFChart();
...

EllipseAnnotation annotation = new EllipseAnnotation()
{
    X1 = new NSNumber(4),

    Y1 = 30,

    X2 = new NSNumber(8),

    Y2 = 35,

    YAxisName = "YAxis"
};

chart.Annotations.Add(annotation);

SFSplineSeries series = new SFSplineSeries();

series.ItemsSource = new ViewModel().Data;

series.XBindingPath = "Name";

series.YBindingPath = "Value";

series.YAxis = new SFNumericalAxis()
{
    Name = new NSString("YAxis"),

    OpposedPosition = true,
};

chart.Series.Add(series);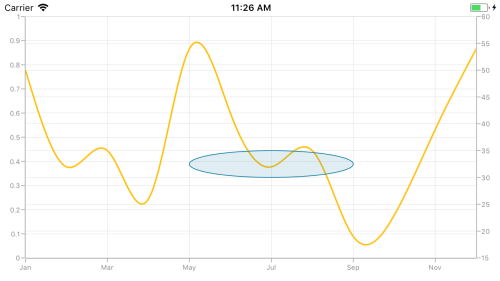
Text annotation
The TextAnnotation is used to add simple text with the help of Text property in specific points over the chart area.
SFChart chart = new SFChart();
...

TextAnnotation annotation = new TextAnnotation()
{
    X1 = 7,

    Y1 = 35,

    Text = "August"
};

chart.Annotations.Add(annotation);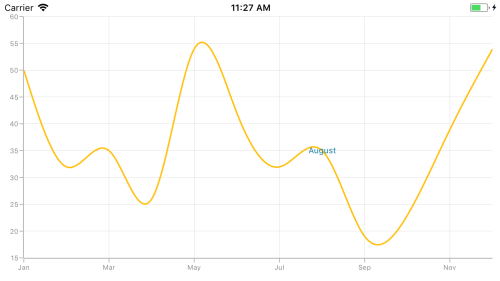
Customizing text annotation
The TextAnnotation can be customized by using the LabelStyle property. The following properties are used to customize the text:
-
Color– Used to change the color of the text. -
BackgroundColor– Used to change the background color of the text. -
BorderColor– Used to change the border color. -
BorderWidth– Used to change the width of the border. -
Font– Used to change the text size, family, and weight. -
Margin- Used to change the margin of the text. -
HorizontalLabelAlignment– Used to align the text horizontally(Center,Start,End. -
VerticalLabelAlignment– Used to align the text vertically(Center,Start,End.
SFChart chart = new SFChart();
...

TextAnnotation annotation = new TextAnnotation()
{
    X1 = 7,

    Y1 = 35,

    Text = "August"
};

annotation.LabelStyle.Margin = new UIEdgeInsets(5, 5, 5, 5);

annotation.LabelStyle.Font = UIFont.ItalicSystemFontOfSize(16);

annotation.LabelStyle.BorderColor = UIColor.Red;

annotation.LabelStyle.BorderWidth = 2;

annotation.LabelStyle.BackgroundColor = UIColor.FromRGB(00,80,80);

annotation.LabelStyle.Color = UIColor.White;

annotation.LabelStyle.VerticalLabelAlignment = ChartAnnotationAlignment.Start;

chart.Annotations.Add(annotation);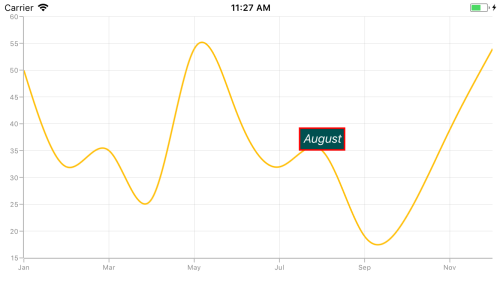
Shape annotation
The ShapeAnnotation allows you to add annotations in the form of shapes such as rectangle, ellipse, horizontal line, vertical line, etc., at the specific area of interest in the chart area.
-
RectangleAnnotation– Used to draw a rectangle over the chart area. -
EllipseAnnotation– Used to draw a circle or an ellipse over the chart area. -
LineAnnotation– Used to draw a line over the chart area. -
VerticalLineAnnotation– Used to draw a vertical line across the chart area. -
HorizontalLineAnnotation– Used to draw a horizontal line across the chart area.
The following APIs are commonly used in all ShapeAnnotation:
-
X2– Represents the X2 coordinate of the shape annotation. -
Y2– Represents the Y2 coordinate of the shape annotation. -
FillColor– Represents the inside background color of the shape annotation. -
StrokeColor– Represents the stroke color of the shape annotation. -
StrokeWidth– Represents the stroke width of the shape annotation. -
StrokeDashArray– Represents the stroke dashes of the shape annotation. -
Text– Represents the annotation text of the shape annotation. -
LabelStyle– Represents the style for customizing the annotation text of shape annotation.
Rectangle annotation
The RectangleAnnotation is used to draw a rectangle or a square in specific points over the chart area. You can customize the rounded corners of the rectangle using CornerRadius property.
SFChart chart = new SFChart();
...

RectangleAnnotation annotation = new RectangleAnnotation()
{
    X1 = new NSNumber(4),

    Y1 = 20,

    X2 = new NSNumber(6),

    Y2 = 55,
};

chart.Annotations.Add(annotation);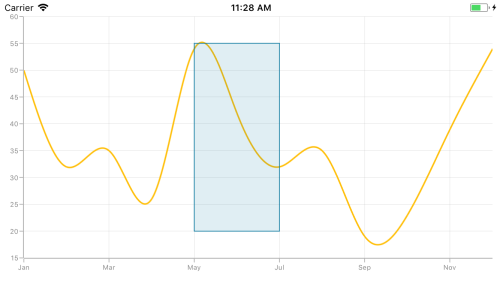
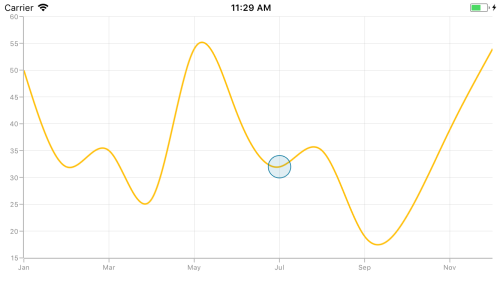
Ellipse annotation
The EllipseAnnotation is used to draw an oval or a circle in specific points over the chart area. You can also specify the height and width of EllipseAnnotation by using the Height and Width properties.
SFChart chart = new SFChart();
...

EllipseAnnotation annotation = new EllipseAnnotation()
{
    X1 = new NSNumber(6),

    Y1 = 32,

    Height = 30,

    Width = 30
};

chart.Annotations.Add(annotation);
NOTE
When
X2andY2properties ofEllipseAnnotationare set,HeightandWidthproperties do not work.
Line annotation
The LineAnnotation is used to draw a line in specific points over the chart area.
SFChart chart = new SFChart();
...

LineAnnotation annotation = new LineAnnotation()
{
    X1 = new NSNumber(2),

    Y1 = 35,

    X2 = new NSNumber(8),

    Y2 = 45,

    Text = "Line"
};

chart.Annotations.Add(annotation);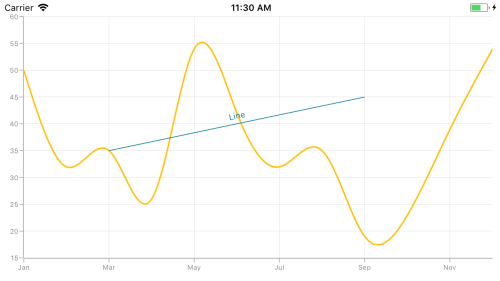
Adding arrow to line annotation
To display single headed arrow, set the LineCap property to Arrow. The default value of the LineCap property is None.
SFChart chart = new SFChart();
...

LineAnnotation annotation = new LineAnnotation()
{
    X1 = new NSNumber(2),

    Y1 = 40,

    X2 = new NSNumber(10),

    Y2 = 40,

    LineCap = ChartLineCap.Arrow
};

chart.Annotations.Add(annotation);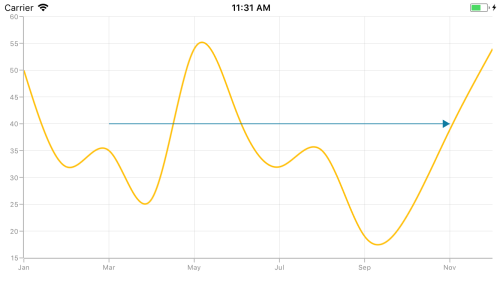
Vertical and Horizontal line annotations
The VerticalLineAnnotation and HorizontalLineAnnotation are used to draw vertical and horizontal lines in specific points over the chart area.
SFChart chart = new SFChart();
...

VerticalLineAnnotation vertical = new VerticalLineAnnotation()
{
    X1 = new NSNumber(6),
};

chart.Annotations.Add(vertical);

HorizontalLineAnnotation horizontal = new HorizontalLineAnnotation()
{
    Y1 = 35
};

chart.Annotations.Add(horizontal);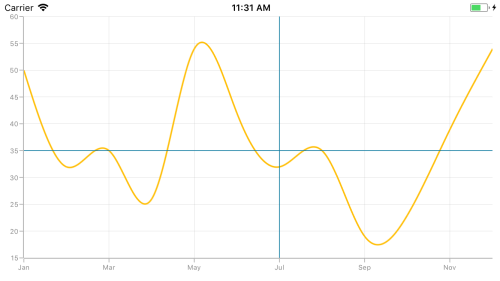
Displaying axis label for vertical and horizontal line annotations
The VerticalLineAnnotation and HorizontalLineAnnotation display the axis labels in which the line is placed. This feature can be enabled by setting the ShowAxisLabel property to true as shown in the below code snippet,
SFChart chart = new SFChart();
...

VerticalLineAnnotation vertical = new VerticalLineAnnotation()
{
    X1 = new NSNumber(6),

    ShowAxisLabel = true
};

chart.Annotations.Add(vertical);

HorizontalLineAnnotation horizontal = new HorizontalLineAnnotation()
{
    Y1 = 35,

    ShowAxisLabel = true,
};

chart.Annotations.Add(horizontal);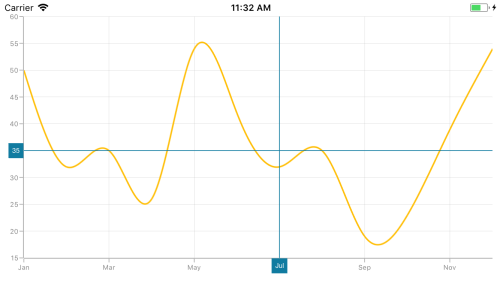
Customizing axis label
The default appearance of the axis label also can be customized by using the AxisLabelStyle property. The following properties are used to customize the axis label:
-
Color- Used to change the color of the text. -
BackgroundColor- Used to change the background color of the text. -
BorderColor- Used to change the border color. -
BorderWidth- Used to change the border width. -
Font- Used to change text font size, family, and weight. -
Margin- Used to set the margin for text. -
LabelsPosition- Used to position the text atInsideorOutsideof the chart axis. By default, the text will be positioned outside the chart axis. -
LabelAlignment- Used to align the label at the start, center, or end. -
CornerRadius- Used to change the corner radius of the background. -
MaxWidth- Provides the maximum text width of the axis label and wraps into the next line when exceeds the maximum width. -
WrappedLabelAlignment- Positions the wrapped text at the start, center, or end. The default value of theWrappedLabelAlignmentproperty is set toStart.
SFChart chart = new SFChart();
...

VerticalLineAnnotation vertical = new VerticalLineAnnotation()
{
    X1 = new NSNumber(6),

    ShowAxisLabel = true,
};

vertical.AxisLabelStyle.Margin = new UIEdgeInsets(5, 5, 5, 5);

vertical.AxisLabelStyle.Font = UIFont.ItalicSystemFontOfSize(12);

vertical.AxisLabelStyle.BorderColor = UIColor.Blue;

vertical.AxisLabelStyle.BorderWidth = 2;

vertical.AxisLabelStyle.BackgroundColor = UIColor.Red;

vertical.AxisLabelStyle.Color = UIColor.White;

vertical.AxisLabelStyle.CornerRadius = new ChartCornerRadius(5);

chart.Annotations.Add(vertical);

HorizontalLineAnnotation horizontal = new HorizontalLineAnnotation()
{
    Y1 = 35,

    ShowAxisLabel = true
};

horizontal.AxisLabelStyle.Margin = new UIEdgeInsets(5, 5, 5, 5);

horizontal.AxisLabelStyle.Font = UIFont.ItalicSystemFontOfSize(12);

horizontal.AxisLabelStyle.BorderColor = UIColor.Blue;

horizontal.AxisLabelStyle.BorderWidth = 2;

horizontal.AxisLabelStyle.BackgroundColor = UIColor.Red;

horizontal.AxisLabelStyle.Color = UIColor.White;

horizontal.AxisLabelStyle.LabelAlignment = ChartAxisLabelAlignment.Start;

chart.Annotations.Add(horizontal);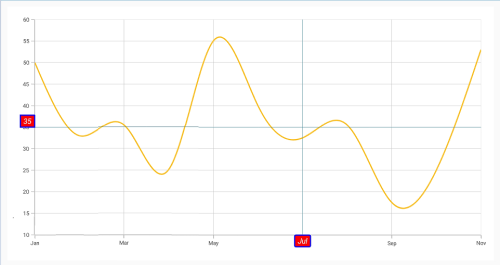
Adding arrow to vertical and horizontal line annotations
To display single headed arrow, set the LineCap property to Arrow. The default value of the LineCap property is None.
SFChart chart = new SFChart();
...

VerticalLineAnnotation vertical = new VerticalLineAnnotation()
{
    X1 = new NSNumber(6),

    LineCap = ChartLineCap.Arrow
};

chart.Annotations.Add(vertical);

HorizontalLineAnnotation horizontal = new HorizontalLineAnnotation()
{
    Y1 = 35,

    LineCap = ChartLineCap.Arrow
};

chart.Annotations.Add(horizontal);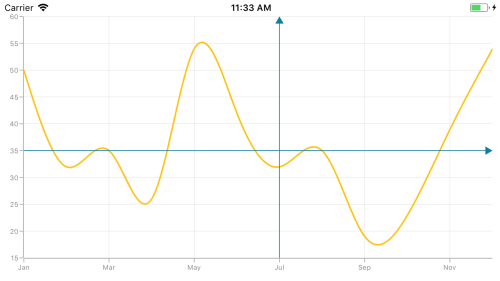
Adding text in shape annotation
For all the shape annotations, the text can be displayed by using the Text property.
Customizing text in shape annotation
The text in shape annotation also can be customized by using the LabelStyle property. The following properties are used to customize the text:
-
Color– Used to change the color of the text. -
BackgroundColor– Used to change the background color of the text. -
BorderColor– Used to change the border color. -
BorderWidth– Used to change the width of the border. -
Font– Used to change the text size, family, and weight. -
Margin- Used to change the margin of the text. -
HorizontalLabelAlignment– Used to align the text horizontally. -
VerticalLabelAlignment– Used to align the text vertically.
SFChart chart = new SFChart();
...

EllipseAnnotation annotation = new EllipseAnnotation()
{
    X1 = 2,

    Y1 = 30,

    X2 = 6,

    Y2 = 35,

    Text = "Ellipse"
};

annotation.LabelStyle.Margin = new UIEdgeInsets(5, 5, 5, 5);

annotation.LabelStyle.Font = UIFont.ItalicSystemFontOfSize(16);

annotation.LabelStyle.BorderColor = UIColor.Red;

annotation.LabelStyle.BorderWidth = 2;

annotation.LabelStyle.BackgroundColor = UIColor.Blue;

annotation.LabelStyle.Color = UIColor.White;

chart.Annotations.Add(annotation);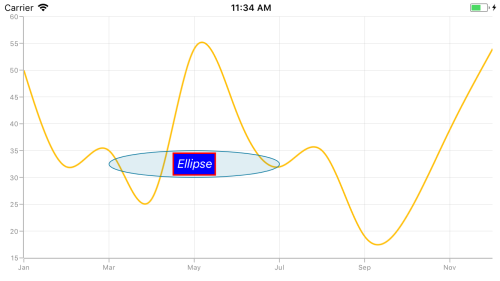
View annotation
The ViewAnnotation allows you to add annotations in the form of own custom view with the help of View property at the specific area of interest in the chart area. The ViewAnnotation also can be aligned by using the VerticalAlignment and HorizontalAlignment properties.
SFChart chart = new SFChart();
...

ViewAnnotation annotation = new ViewAnnotation()
{
    X1 = 3,

    Y1 = 12,

    VerticalAlignment = ChartAnnotationAlignment.Start
};

UIImageView imageView = new UIImageView();

imageView.Frame = new CoreGraphics.CGRect(0,0,70,70);

imageView.Image = UIImage.FromFile("Graduate.png");

annotation.View = imageView;

chart.Annotations.Add(annotation);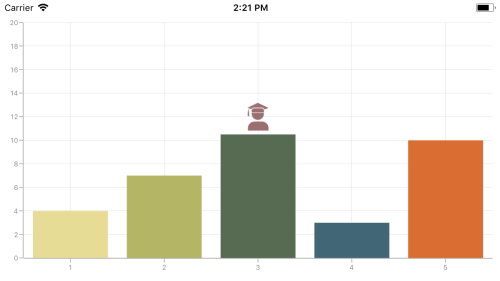
Annotation Visibility
The Visible property of ChartAnnotation is used to control the visibility of particular annotation. Default value of Visible property is true.
VerticalLineAnnotation verticalLineAnnotation = new VerticalLineAnnotation()
{
    Visible = false
};

chart.ChartAnnotations.Add(verticalLineAnnotation);
Event
AnnotationClicked
The AnnotationClicked event is triggered when the user has clicked the annotation. The argument contains the following information.
-
Annotation– used to get the instance of annotation which is clicked. -
X– used to get the x position of touch point on annotation. -
Y– used to get the y position of touch point on annotation..
Get the touch position in annotation
Following are the override methods that are available in annotation to send the information about touch interactions.
-
TouchBegan– occurs when touch down inside the annotation. -
TouchMove– occurs while moving the finger inside the annotation. -
TouchCancelled– called when touch cancelled on the annotation area. -
TouchEnded– occurs when touch up inside the annotation.
public class TextAnnotationExt : TextAnnotation
{
   protected override void TouchBegan(NSSet touches, UIEvent uiEvent)
   {
      base.TouchBegan(touches, uiEvent);
   }

   protected override void TouchMove(NSSet touches, UIEvent uiEvent)
   {
      base.TouchMove(touches, uiEvent);
   }

   protected override void TouchCancelled(NSSet touches, UIEvent uiEvent)
   {
      base.TouchCancelled(touches, uiEvent);
   }

   protected override void TouchEnded(NSSet touches, UIEvent uiEvent)
   {
      base.TouchEnded(touches, uiEvent);
   }
}
Methods
Adding separate view for annotation
The ChartAnnotationView is used to render Annotation using the GetView method. The following code sample demonstrates how to add a separate view for annotation.
[C#]

 public class CustomEllipseAnnotation : EllipseAnnotation
        {
		    ChartAnnotationView view = new ChartAnnotationView();
            protected override ChartAnnotationView GetView()
            {
                return view;

            }
        }