Series in WPF SfChart3D
13 Jul 202617 minutes to read
ChartSeries is the visual representation of the data. SfChart3D offers eight types of series. Based on your requirements and specifications, any type of series can be added for data visualization.
- Column
- Bar
- Line
- Scatter
- Area
- Stacking Column
- Stacking Column 100
- Stacking Bar
- Stacking Bar 100
- Pie
- Doughnut
The following APIs are common for most of the series types:
-
XBindingPath– A string property that represents the X values for the series. -
YBindingPath– A string property that represents the Y values for the series. -
Interior– Represents the brush to fill the series.
Column Charts
ColumnSeries3D plots discrete rectangles for the given values.
<chart:ColumnSeries3D
    ItemsSource="{Binding CategoricalData}"
    XBindingPath="Year"
    YBindingPath="Metal">
</chart:ColumnSeries3D>
ColumnSeries3D series = new ColumnSeries3D()
{
ItemsSource = new CategoryDataViewModel().CategoricalData,
XBindingPath = "Year",
YBindingPath = "Metal"
};
chart3D.Series.Add(series);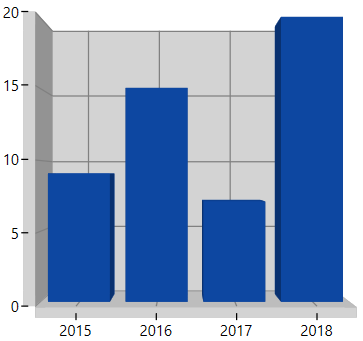
Bar Charts
BarSeries3D is similar to column series, except for its orientation.
<chart:BarSeries3D
    ItemsSource="{Binding CategoricalData}"
    XBindingPath="Year"
    YBindingPath="Plastic">
</chart:BarSeries3D>
BarSeries3D series = new BarSeries3D()
{
ItemsSource = new CategoryDataViewModel().CategoricalData,
XBindingPath = "Year",
YBindingPath = "Plastic"
};
chart3D.Series.Add(series);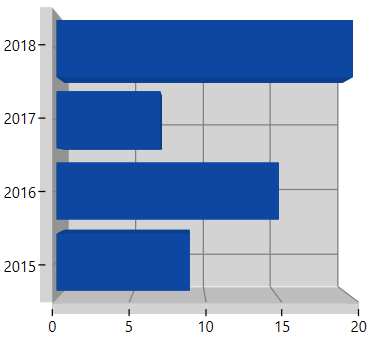
Spacing
Spacing property of series is used to decide the width of a segment. Spacing value ranges from 0 to 1. The following code illustrates how to set Spacing property of the series,
<chart:ColumnSeries3D
    chart:ChartSeriesBase.Spacing="0.6"
    ItemsSource="{Binding CategoricalData}"
    XBindingPath="Year"
    YBindingPath="Plastic">
</chart:ColumnSeries3D>
ColumnSeries3D series = new ColumnSeries3D()
{
ItemsSource = new CategoryDataViewModel().CategoricalData,
XBindingPath = "Year",
YBindingPath = "Plastic"
};
ChartSeriesBase.SetSpacing(series, 0.6);
chart3D.Series.Add(series);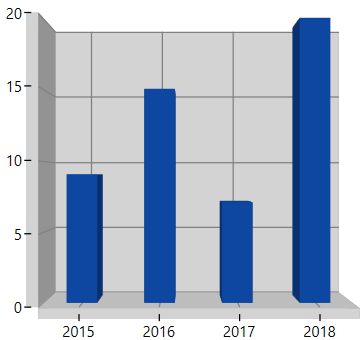
Segment Spacing
SegmentSpacing property is used to set the spacing among the segments, when multiple series are added in chart. Its value ranges from 0 to 1. The following code illustrates how to use the SegmentSpacing property in series.
<chart:ColumnSeries3D
    SegmentSpacing="0.6"
    ItemsSource="{Binding CategoricalData}"
    XBindingPath="Year"
    YBindingPath="Plastic"/>

<chart:ColumnSeries3D
    SegmentSpacing="0.6"
    ItemsSource="{Binding CategoricalData}"
    XBindingPath="Year"
    YBindingPath="Iron"/>
ColumnSeries3D series = new ColumnSeries3D()
{
ItemsSource = new CategoryDataViewModel().CategoricalData,
XBindingPath = "Year",
YBindingPath = "Plastic",
SegmentSpacing = 0.6,
};
ColumnSeries3D series1 = new ColumnSeries3D()
{
ItemsSource = new CategoryDataViewModel().CategoricalData,
XBindingPath = "Year",
YBindingPath = "Iron",
SegmentSpacing = 0.6,
};
chart3D.Series.Add(series);
chart3D.Series.Add(series1);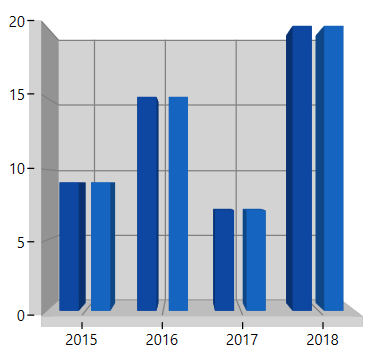
Line Charts
LineSeries3D join points on a plot by straight lines, showing data trends at equal intervals.
<chart:LineSeries3D
    ItemsSource="{Binding CategoricalData}"
    XBindingPath="Year"
    YBindingPath="Metal">
</chart:LineSeries3D>
LineSeries3D line = new LineSeries3D()
{
ItemsSource = new CategoryDataViewModel().CategoricalData,
XBindingPath = "Year",
YBindingPath = "Metal"
};
chart3D.Series.Add(line);
Scatter Chart
ScatterSeries3D will represent each point by a Rectangle with equal size.
This size can be defined by using below properties.
<chart:ScatterSeries3D
    ItemsSource="{Binding DataPoints}"
    XBindingPath="Year"
    YBindingPath="Germany">
</chart:ScatterSeries3D>
ScatterSeries3D series = new ScatterSeries3D()
{
ItemsSource = new ViewModel().DataPoints,
XBindingPath = "Year",
YBindingPath = "Germany"
};
chart3D.Series.Add(series);
Area Chart
AreaSeries3D is rendered using a collection of line segments connected to form a closed loop area, filled with the specified color.
<chart:AreaSeries3D
    ItemsSource="{Binding CategoricalData}"
    XBindingPath="Year"
    YBindingPath="Plastic">
</chart:AreaSeries3D>
AreaSeries3D series = new AreaSeries3D()
{
ItemsSource = new CategoryDataViewModel().CategoricalData,
XBindingPath = "Year",
YBindingPath = "Plastic"
};
chart3D.Series.Add(series);
Stacking Charts
Stacking Column
StackingColumnSeries3D resembles multiple types of ColumnSeries3D. Each series is vertically stacked one above the other. When there is only one series, it resembles a simple ColumnSeries.
The following code example illustrates how to use StackingColumnSeries3D:
<chart:StackingColumnSeries3D
    ItemsSource="{Binding CategoricalData}"
    XBindingPath="Year"
    YBindingPath="Plastic"/>

<chart:StackingColumnSeries3D
    ItemsSource="{Binding CategoricalData}"
    XBindingPath="Year"
    YBindingPath="Iron"/>

<chart:StackingColumnSeries3D
    ItemsSource="{Binding CategoricalData}"
    XBindingPath="Year"
    YBindingPath="Metal"/>
StackingColumnSeries3D stack1 = new StackingColumnSeries3D()
{
ItemsSource = new CategoryDataViewModel().CategoricalData,
XBindingPath = "Year",
YBindingPath = "Plastic"
};
StackingColumnSeries3D stack2 = new StackingColumnSeries3D()
{
ItemsSource = new CategoryDataViewModel().CategoricalData,
XBindingPath = "Year",
YBindingPath = "Iron"
};
StackingColumnSeries3D stack3 = new StackingColumnSeries3D()
{
ItemsSource = new CategoryDataViewModel().CategoricalData,
XBindingPath = "Year",
YBindingPath = "Metal"
};
chart3D.Series.Add(stack1);
chart3D.Series.Add(stack2);
chart3D.Series.Add(stack3);
Stacking Column 100
StackingColumn100Series3D resembles StackingColumnSeries3D, but the cumulative portion of each stacked element always totals 100%.
The following code example illustrates how to use StackingColumn100Series3D:
<chart:StackingColumn100Series3D
    ItemsSource="{Binding CategoricalData}"
    XBindingPath="Year"
    YBindingPath="Plastic">
</chart:StackingColumn100Series3D>

<chart:StackingColumn100Series3D
    Interior="Brown"
    ItemsSource="{Binding CategoricalData}"
    XBindingPath="Year"
    YBindingPath="Iron">
</chart:StackingColumn100Series3D>
StackingColumn100Series3D stack1 = new StackingColumn100Series3D()
{
ItemsSource = new CategoryDataViewModel().CategoricalData,
XBindingPath = "Year",
YBindingPath = "Plastic"
};
StackingColumn100Series3D stack2 = new StackingColumn100Series3D()
{
ItemsSource = new CategoryDataViewModel().CategoricalData,
XBindingPath = "Year",
YBindingPath = "Iron",
Interior = new SolidColorBrush(Colors.Brown)
};
chart3D.Series.Add(stack1);
chart3D.Series.Add(stack2);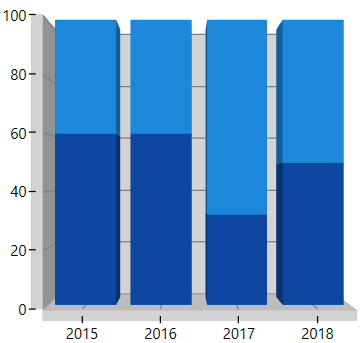
Stacking Bar
StackingBarSeries3D is a multiple series type of BarSeries3D. Each BarSeries3D is then stacked horizontally, side by side to each other. When there exists only one series, it resembles a simple BarSeries3D.
The following code example illustrates how to use StackingBarSeries3D:
<chart:StackingBarSeries3D
    ItemsSource="{Binding CategoricalData}"
    XBindingPath="Year"
    YBindingPath="Plastic"/>

<chart:StackingBarSeries3D
    ItemsSource="{Binding CategoricalData}"
    XBindingPath="Year"
    YBindingPath="Iron"/>

<chart:StackingBarSeries3D
    ItemsSource="{Binding CategoricalData}"
    XBindingPath="Year"
    YBindingPath="Metal"/>
StackingBarSeries3D stack1 = new StackingBarSeries3D()
{
ItemsSource = new CategoryDataViewModel().CategoricalData,
XBindingPath = "Year",
YBindingPath = "Plastic"
};
StackingBarSeries3D stack2 = new StackingBarSeries3D()
{
ItemsSource = new CategoryDataViewModel().CategoricalData,
XBindingPath = "Year",
YBindingPath = "Iron"
};
StackingBarSeries3D stack3 = new StackingBarSeries3D()
{
ItemsSource = new CategoryDataViewModel().CategoricalData,
XBindingPath = "Year",
YBindingPath = "Metal"
};
chart3D.Series.Add(stack1);
chart3D.Series.Add(stack2);
chart3D.Series.Add(stack3);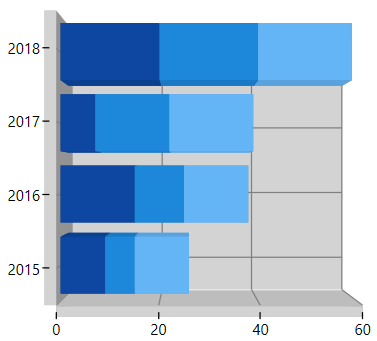
Stacking Bar 100
StackingBar100Series3D resembles StackingBarSeries3D. StackingBar100Series3D displays multiple series as stacked bars, and the cumulative portion of each stacked element is always 100%.
The following code example illustrates how to use StackingBar100Series3D:
<chart:StackingBar100Series3D
    ItemsSource="{Binding CategoricalData}"
    XBindingPath="Year"
    YBindingPath="Plastic"/>

<chart:StackingBar100Series3D
    ItemsSource="{Binding CategoricalData}"
    XBindingPath="Year"
    YBindingPath="Iron"/>
StackingBar100Series3D stack1 = new StackingBar100Series3D()
{
ItemsSource = new CategoryDataViewModel().CategoricalData,
XBindingPath = "Year",
YBindingPath = "Plastic"
};
StackingBar100Series3D stack2 = new StackingBar100Series3D()
{
ItemsSource = new CategoryDataViewModel().CategoricalData,
XBindingPath = "Year",
YBindingPath = "Iron"
};
chart3D.Series.Add(stack1);
chart3D.Series.Add(stack2);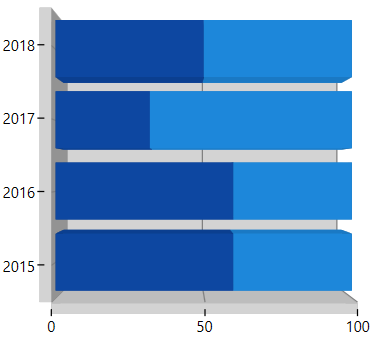
Pie Chart
PieSeries3D is divided into sectors, illustrating numerical proportions.
The following code example illustrates the PieSeries3D.
<chart:PieSeries3D
    ItemsSource="{Binding CategoricalData}"
    XBindingPath="Year"
    YBindingPath="Iron">
</chart:PieSeries3D>
PieSeries3D series = new PieSeries3D()
{
ItemsSource = new CategoryDataViewModel().CategoricalData,
XBindingPath = "Year",
YBindingPath = "Iron"
};
chart3D.Series.Add(series);
Doughnut Chart
DoughnutSeries3D is similar to PieSeries3D. It is used to show the relationship between parts of data and the whole data.
The DoughnutSeries3D can be added to the chart as shown in the below code example:
<chart:DoughnutSeries3D
    ItemsSource="{Binding CategoricalData}"
    XBindingPath="Year"
    YBindingPath="Iron">
</chart:DoughnutSeries3D>
DoughnutSeries3D series = new DoughnutSeries3D()
{
ItemsSource = new CategoryDataViewModel().CategoricalData,
XBindingPath = "Year",
YBindingPath = "Iron"
};
chart.Series.Add(series);
Coefficient
The DoughnutCoefficient and CircleCoefficient properties are used to define the inner circle of Doughnut and Pie Charts.
<chart:DoughnutSeries3D
    ItemsSource="{Binding CategoricalData}"
    DoughnutCoefficient="0.5"
    XBindingPath="Year"
    YBindingPath="Iron">
</chart:DoughnutSeries3D>
DoughnutSeries3D series = new DoughnutSeries3D()
{
ItemsSource = new CategoryDataViewModel().CategoricalData,
XBindingPath = "Year",
YBindingPath = "Iron",
DoughnutCoefficient=0.5
};
chart.Series.Add(series);
Semi Pie and Doughnut
By using custom StartAngle and EndAngle properties, you can draw pie series in different shapes such as semi or quarter circular series.
<chart:DoughnutSeries3D
    StartAngle="180"
    EndAngle="360"
    ItemsSource="{Binding CategoricalData}"
    DoughnutCoefficient="0.7"
    XBindingPath="Year"
    YBindingPath="Iron">
</chart:DoughnutSeries3D>
DoughnutSeries3D series = new DoughnutSeries3D()
{
ItemsSource = new CategoryDataViewModel().CategoricalData,
XBindingPath = "Year",
YBindingPath = "Iron",
DoughnutCoefficient=0.7,
StartAngle=180,
EndAngle=360
};
chart.Series.Add(series);
Pie
<chart:PieSeries3D
    StartAngle="180"
    EndAngle="360"
    ItemsSource="{Binding CategoricalData}"
    CircleCoefficient="0.7"
    XBindingPath="Year"
    YBindingPath="Iron">
</chart:PieSeries3D>
PieSeries3D series = new PieSeries3D()
{
ItemsSource = new CategoryDataViewModel().CategoricalData,
XBindingPath = "Year",
YBindingPath = "Iron",
CircleCoefficient = 0.7,
StartAngle = 180,
EndAngle = 360
};
chart.Series.Add(series);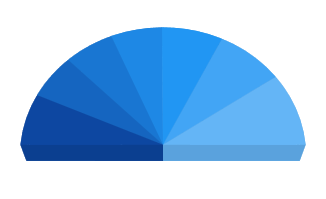
Dynamic explode
This feature allows users to explode a particular segment in a circular series using ExplodeOnMouseClick. This can also be achieved by setting the ExplodeIndex or ExplodeAll property.
The following code example illustrates how to enable dynamic explode for circular series. For data, please refer to the Series category in 3D charts.
<chart:SfChart3D
    EnableRotation="True"
    Tilt="-30"
    Rotation="45"
    Depth="30"
    PerspectiveAngle="90"
    Width="500"
    Height="500">

    <!-- PrimaryAxis -->
    <chart:SfChart3D.PrimaryAxis>
        <chart:CategoryAxis3D Header="Year"/>
    </chart:SfChart3D.PrimaryAxis>

    <!-- SecondaryAxis -->
    <chart:SfChart3D.SecondaryAxis>
        <chart:NumericalAxis3D Header="Metal"/>
    </chart:SfChart3D.SecondaryAxis>

    <!-- PieSeries3D - Dynamic explode -->
    <chart:PieSeries3D
        ExplodeOnMouseClick="True"
        ItemsSource="{Binding CategoricalData}"
        XBindingPath="Year"
        YBindingPath="Iron"/>
</chart:SfChart3D>