How can I help you?
Appearance in WPF SfChart3D
25 May 20267 minutes to read
SfChart3D supports various customizing and styling options that allow you to enrich the application.
Palettes
SfChart3D provides the options to apply the different kinds of themes or palettes to your chart. You can define the Palette either for the entire chart or for an individual series.
We have some predefined palette such as,
- Metro
- AutumnBrights
- FloraHues
- Pineapple
- TomotoSpectrum
- RedChrome
- PurpleChrome
- BlueChrome
- GreenChrome
- Elite
- LightCandy
- SandyBeach
Applying Palette to Series
Each palette applies a set of predefined brushes to the series in a predefined order. The following code example shows you how to set the Metro Palette for the chart series.
<chart:SfChart3D Height="250" Width="350" Palette="Metro">chart.Palette = ChartColorPalette.Metro;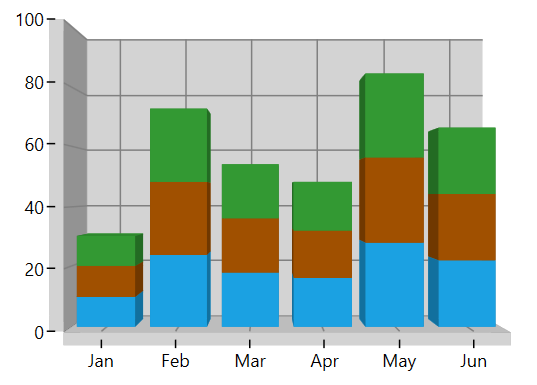
The following code example defined the palette as a BlueChrome.
<chart:SfChart3D Height="250" Width="350" Palette="BlueChrome">chart.Palette = ChartColorPalette.BlueChrome;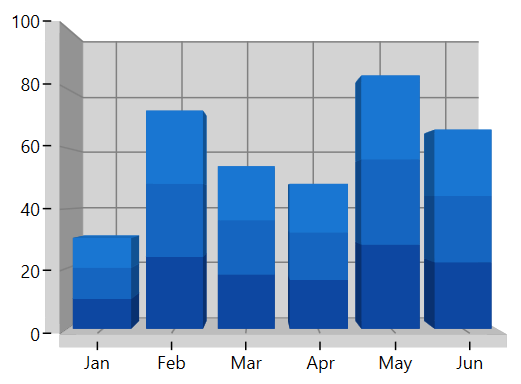
Applying Palette to Segment
Each palette applies a set of predefined brushes to the segment in a predefined order. The following code example shows you how to set the Metro Palette for the chart series.
<syncfusion:ColumnSeries3D
    ItemsSource="{Binding Data}"
    XBindingPath="XValue"
    YBindingPath="YValue"
    Palette="Metro">
</syncfusion:ColumnSeries3D>
ColumnSeries3D columnSeries = new ColumnSeries3D()
{
ItemsSource = viewModel.Data,
XBindingPath = "XValue",
YBindingPath = "YValue",
Palette = ChartColorPalette.Metro
};
chart.Series.Add(columnSeries);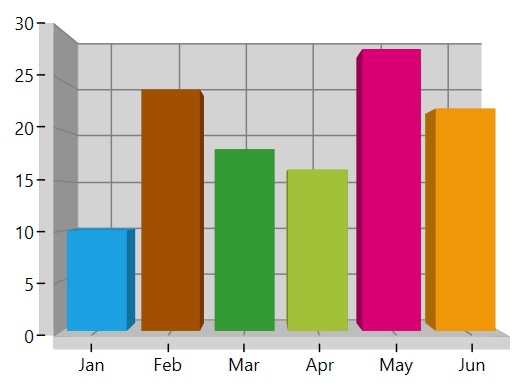
The following code example defined the palette as an AutumnBrights.
<syncfusion:ColumnSeries3D
    ItemsSource="{Binding Data}"
    XBindingPath="XValue"
    YBindingPath="YValue"
    Palette="AutumnBrights">
</syncfusion:ColumnSeries3D>
ColumnSeries3D columnSeries = new ColumnSeries3D()
{
ItemsSource = viewModel.Data,
XBindingPath = "XValue",
YBindingPath = "YValue",
Palette = ChartColorPalette.AutumnBrights
};
chart.Series.Add(series);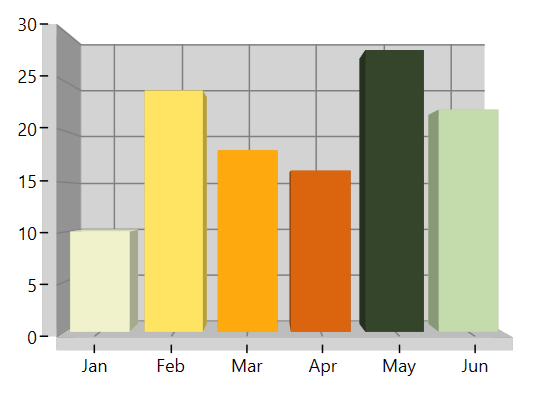
NOTE
Metro palette is the default palette for both Series and Segment.
Custom Palette
SfChart3D provides an option that enables you to define your own color brushes with your preferred order for the Palette using the ColorModel as shown in the following code example.
<chart:DoughnutSeries3D
    YBindingPath="Percentage"
    Palette="Custom"
    XBindingPath="Category"
    ItemsSource="{Binding Tax}">

    <chart:DoughnutSeries3D.ColorModel>
        <chart:ChartColorModel>
            <chart:ChartColorModel.CustomBrushes>
                <SolidColorBrush Color="Cyan"/>
                <SolidColorBrush Color="DarkCyan"/>
            </chart:ChartColorModel.CustomBrushes>
        </chart:ChartColorModel>
    </chart:DoughnutSeries3D.ColorModel>
</chart:DoughnutSeries3D>
ChartColorModel colorModel = new ChartColorModel();
colorModel.CustomBrushes.Add(new SolidColorBrush(Colors.Cyan));
colorModel.CustomBrushes.Add(new SolidColorBrush(Colors.DarkCyan));
DoughnutSeries3D series = new DoughnutSeries3D()
{
ItemsSource = new ViewModel().Tax,
XBindingPath = "Category",
YBindingPath = "Percentage",
Palette = ChartColorPalette.Custom,
ColorModel = colorModel
};
chart.Series.Add(series);
You can define the custom palette for the series as shown in the following code example:
<chart:SfChart3D Height="250" Width="350" Palette="Custom">
    <chart:SfChart3D.ColorModel>
        <chart:ChartColorModel>
            <chart:ChartColorModel.CustomBrushes>
                <SolidColorBrush Color="BlueViolet"/>
                <SolidColorBrush Color="PeachPuff"/>
                <SolidColorBrush Color="Purple"/>
            </chart:ChartColorModel.CustomBrushes>
        </chart:ChartColorModel>
    </chart:SfChart3D.ColorModel>
</chart:SfChart3D>chart.Palette = ChartColorPalette.Custom;
ChartColorModel colorModel = new ChartColorModel();
colorModel.CustomBrushes.Add(new SolidColorBrush(Colors.BlueViolet));
colorModel.CustomBrushes.Add(new SolidColorBrush(Colors.PeachPuff));
colorModel.CustomBrushes.Add(new SolidColorBrush(Colors.Purple));
chart.ColorModel = colorModel;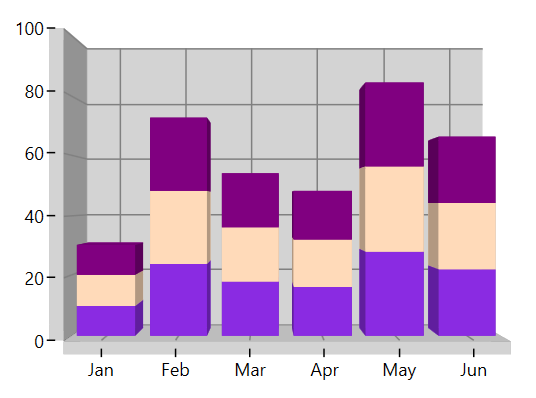
SegmentColorPath
The color for the chart segments can be bound from its items source collection by using the SegmentColorPath property of series. The following code shows how to bind the color to the series with the SegmentColorPath property.
<chart:ColumnSeries3D
    ItemsSource="{Binding Data}"
    XBindingPath="XValue"
    YBindingPath="YValue"
    SegmentColorPath="ColorPath">
</chart:ColumnSeries3D>
ColumnSeries3D series = new ColumnSeries3D()
{
ItemsSource = viewModel.Data,
XBindingPath = "XValue",
YBindingPath = "YValue",
SegmentColorPath = "ColorPath"
};
Data = new ObservableCollection<Model>();
Data.Add(new Model() { XValue = "Jan", YValue = 10, ColorPath = new SolidColorBrush(Colors.Cyan) });
Data.Add(new Model() { XValue = "Feb", YValue = 24, ColorPath = new SolidColorBrush(Colors.Pink) });
Data.Add(new Model() { XValue = "Mar", YValue = 18, ColorPath = new SolidColorBrush(Colors.Red) });
Data.Add(new Model() { XValue = "Apr", YValue = 16, ColorPath = new SolidColorBrush(Colors.Orange) });
Data.Add(new Model() { XValue = "May", YValue = 28, ColorPath = new SolidColorBrush(Colors.LightGreen) });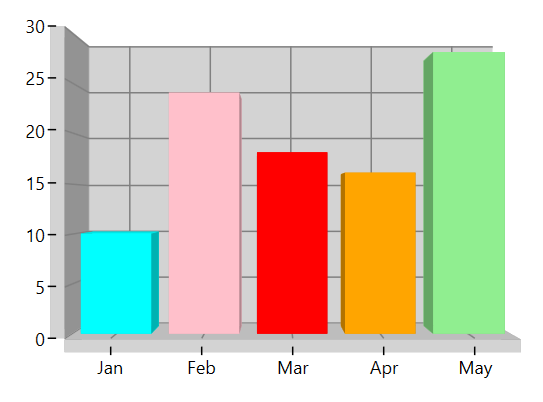
NOTE
The SegmentColorPath property is not applicable to the Area and CircularSeries.