Interactive Features in WPF SfChart3D
13 Jul 20265 minutes to read
3D charts provide interactive features such as dynamic rotation, segment selection, and dynamic segment explode for circular series.
Dynamic rotation
3D charts allow you to view the best possible view of data dynamically using a mouse or touch device. To enable dynamic rotation, set the EnableRotation property to true.
The following code example illustrates how to enable the dynamic rotation:
<Syncfusion:SfChart3D EnableRotation="True" x:Name="Chart" Height="500" Width="600"/>Segment Selection
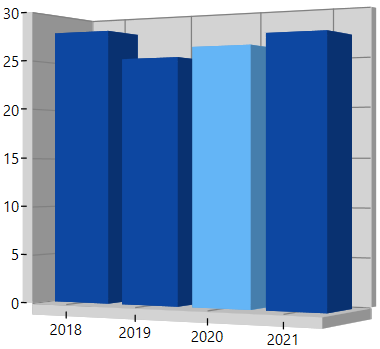
To enable segment selection in a 3D chart, set the SegmentSelectionBrush property of the chart series.
The following code example illustrates how to set the selection brush for individual series. For data, refer to the Series category in 3D charts.
<chart:SfChart3D
    EnableRotation="True"
    PerspectiveAngle="50"
    Rotation="29"
    Depth="100"
    Palette="BlueChrome"
    Width="300"
    Height="280">

    <chart:ColumnSeries3D
        SegmentSelectionBrush="SkyBlue"
        ItemsSource="{Binding DataPoints}"
        XBindingPath="Year"
        YBindingPath="India">
    </chart:ColumnSeries3D>
</chart:SfChart3D>
SfChart3D chart3D = new SfChart3D()
{
EnableSegmentSelection = true,
EnableRotation = true,
PerspectiveAngle = 50,
SeriesSelectedIndex = 0,
Rotation = 29,
Depth = 100,
Palette = ChartColorPalette.BlueChrome,
Width = 300,
Height = 280
};
ColumnSeries3D series = new ColumnSeries3D()
{
ItemsSource = new StockViewModel().DataPoints,
XBindingPath = "Year",
YBindingPath = "India",
SegmentSelectionBrush = new SolidColorBrush(Colors.SkyBlue),
SegmentSpacing = 0.5
};
chart3D.Series.Add(series);The following screenshot illustrates the result of the above code example.
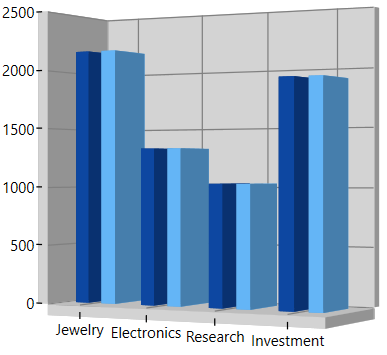
Series Selection
Series selection support is used to highlight the series programmatically or by user interaction. You can also get the series SelectedIndex and PreviousSelectedIndex values in the SelectionChanged event arguments.
The following code example can be used to set series selection in SfChart3D.
<chart:SfChart3D
    EnableRotation="True"
    PerspectiveAngle="50"
    EnableSeriesSelection="True"
    SeriesSelectedIndex="0"
    Rotation="29"
    Depth="100"
    Palette="BlueChrome"
    Width="300"
    Height="280">

    <chart:ColumnSeries3D
        ItemsSource="{Binding Demands}"
        XBindingPath="Category"
        YBindingPath="Value"
        SegmentSpacing="0.5"
        SeriesSelectionBrush="LightGreen">
    </chart:ColumnSeries3D>

    <chart:ColumnSeries3D
        ItemsSource="{Binding Demands}"
        XBindingPath="Category"
        YBindingPath="Value"
        SegmentSpacing="0.5"
        SeriesSelectionBrush="SkyBlue">
    </chart:ColumnSeries3D>
</chart:SfChart3D>
SfChart3D chart3D = new SfChart3D()
{
EnableSeriesSelection = true,
EnableRotation = true,
PerspectiveAngle = 50,
SeriesSelectedIndex = 0,
Rotation = 29,
Depth = 100,
Palette = ChartColorPalette.BlueChrome,
Width = 300,
Height = 280
};
ColumnSeries3D series = new ColumnSeries3D()
{
ItemsSource = new StockViewModel().Demands,
XBindingPath = "Category",
YBindingPath = "Value",
SeriesSelectionBrush = new SolidColorBrush(Colors.LightGreen),
SegmentSpacing = 0.5
};
ColumnSeries3D series1 = new ColumnSeries3D()
{
ItemsSource = new StockViewModel().Demands,
XBindingPath = "Category",
YBindingPath = "Value",
SeriesSelectionBrush = new SolidColorBrush(Colors.SkyBlue),
SegmentSpacing = 0.5
};
chart3D.Series.Add(series);
chart3D.Series.Add(series1);The following screenshot is an example of a SfChart3D with series selection.