Data Markers in WPF SfChart3D
13 Jul 20261 minute to read
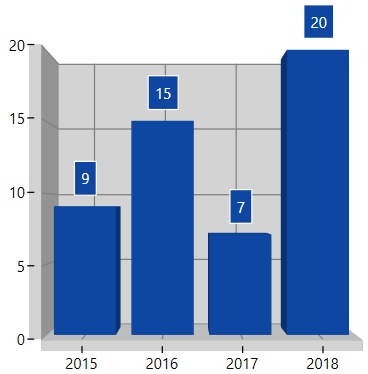
Adornments (Data Markers) are used to provide information about the data points to the user. Values from a data point (x, y) or other custom properties from a data source can be displayed. You can add a shape and label to adorn each data point.
Each adornment can be represented by the following:
- Marker - Displays the desired symbol at the (X, Y) point.
- Label - Displays the segment label content at the (X, Y) point.
- ConnectorLine - Line used to connect the (X, Y) point and the label element.
The following code example illustrates how to initialize the adornment.
<chart:ColumnSeries3D ItemsSource="{Binding CategoricalData}" XBindingPath="Year" YBindingPath="Plastic">

    <!--AdornmentsInfo-->
    <chart:ColumnSeries3D.AdornmentsInfo>
        <chart:ChartAdornmentInfo3D
            UseSeriesPalette="True"
            BorderBrush="White"
            BorderThickness="1"
            ShowLabel="True">
        </chart:ChartAdornmentInfo3D>
    </chart:ColumnSeries3D.AdornmentsInfo>
</chart:ColumnSeries3D>
ColumnSeries3D series = new ColumnSeries3D()
{
ItemsSource = new ViewModel().CategoricalData,
XBindingPath = "Year",
YBindingPath = "Plastic"
};
ChartAdornmentInfo3D adornmentInfo = new ChartAdornmentInfo3D()
{
ShowLabel = true
};
series.AdornmentsInfo = adornmentInfo;
chart.Series.Add(series);