WPF SfChart3D Overview
6 Jan 20251 minute to read
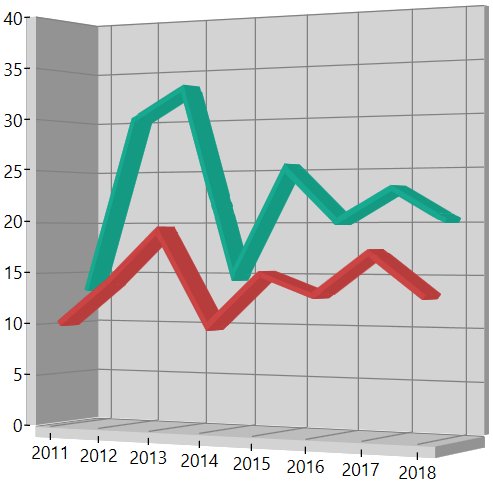
3D charts are used to view two-dimensional data in a three-dimensional view, and can be rotated in all 3 dimensions to get the best possible view of the data.

Key features
-
SfChart3D supports different type of
Serieswhich can be used for different data visualizations.Each type of chart represents a unique style of representing data with more user friendly and greater UI visualization. -
Supports several axes types which can be used with the charts. There are axes specialized for Numerical, Category, DateTime, TimeSpan, Logarithmic scenarios.
-
SfChart3D supports DepthAxis (Z Axis) helps us to plot chart data based on X, Y and Z Co – ordinates.
-
Supports multiple axes that can be stacked and spanned for multiple panes.
-
Allows you to map the data from the specified path, by achieving, Data binding concept.
-
Animations allows to animate the chart series on loading, and whenever the ItemsSource changes.
-
Dynamic rotation allows to view the best possible view of data dynamically using a mouse or touch device.
-
Selection support allows to select Segment and series programmatically or user interaction.