Getting Started with WPF SfChart3D
13 Jul 202615 minutes to read
This section explains the steps required to populate the Chart with data, header, add data labels, legend and tooltips to the Chart. This section covers only the minimal features that you need to learn to get started with the Chart.
Adding chart reference
Refer to this article to learn how to add Syncfusion® controls to Visual Studio projects in various ways. You can also refer to this link to learn about the assemblies required for adding Chart to your project.
Initialize chart
Import the SfChart3D namespace in your XAML page.
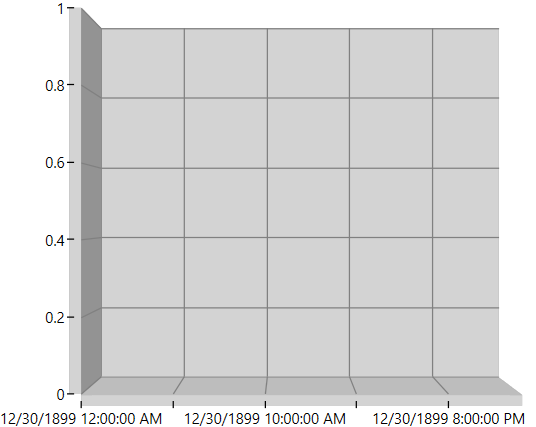
xmlns:chart="clr-namespace:Syncfusion.UI.Xaml.Charts;assembly=Syncfusion.SfChart.WPF"using Syncfusion.UI.Xaml.Charts;Then initialize an empty chart with PrimaryAxis and SecondaryAxis as shown below,
<chart:SfChart3D>
    <!--PrimaryAxis-->
    <chart:SfChart3D.PrimaryAxis>
        <chart:DateTimeAxis3D/>
    </chart:SfChart3D.PrimaryAxis>

    <!--SecondaryAxis-->
    <chart:SfChart3D.SecondaryAxis>
        <chart:NumericalAxis3D/>
    </chart:SfChart3D.SecondaryAxis>
</chart:SfChart3D>
SfChart3D Chart3D = new SfChart3D()
{
PrimaryAxis = new DateTimeAxis3D(),
SecondaryAxis = new NumericalAxis3D(),
};
Initialize view model
Since the above step will produce only an empty 3D chart, plotting data must be added to the chart. This step illustrates how to create a sample data source. The data source must implement the IEnumerable interface.
public class UserProfile
{
    public DateTime TimeStamp { get; set; }
    public double NoOfUsers { get; set; }
}
Next, create a view model class and initialize a list of UserProfile objects as follows.
public class UsersViewModel
{
    public ObservableCollection<UserProfile> UsersList { get; set; }

    public UsersViewModel()
    {
        UsersList = new ObservableCollection<UserProfile>();

        DateTime date = DateTime.Today;

        UsersList.Add(new UserProfile { TimeStamp = date.AddHours(0.5), NoOfUsers = 1000 });
        UsersList.Add(new UserProfile { TimeStamp = date.AddHours(1), NoOfUsers = 5000 });
        UsersList.Add(new UserProfile { TimeStamp = date.AddHours(1.5), NoOfUsers = 3000 });
        UsersList.Add(new UserProfile { TimeStamp = date.AddHours(2), NoOfUsers = 4000 });
        UsersList.Add(new UserProfile { TimeStamp = date.AddHours(2.5), NoOfUsers = 2000 });
        UsersList.Add(new UserProfile { TimeStamp = date.AddHours(3), NoOfUsers = 1000 });
    }
}
Set the ViewModel instance as the DataContext of your window; this is done to bind properties of ViewModel.
<Window x:Class="GettingStarted_3DCharts.MainWindow"
        xmlns="http://schemas.microsoft.com/winfx/2006/xaml/presentation"
        xmlns:x="http://schemas.microsoft.com/winfx/2006/xaml"
        xmlns:d="http://schemas.microsoft.com/expression/blend/2008"
        xmlns:mc="http://schemas.openxmlformats.org/markup-compatibility/2006"
        xmlns:local="clr-namespace:GettingStarted_3DCharts "
        xmlns:chart ="clr-namespace:Syncfusion.UI.Xaml.Charts;assembly=Syncfusion.SfChart.WPF"
        mc:Ignorable="d"
        Title="MainWindow" Height="350" Width="525">

    <Window.DataContext>
        <local:UsersViewModel/>
    </Window.DataContext>

</Window>this.DataContext = new UsersViewModel();NOTE
Add the namespace of the
ViewModelclass to your XAML window if you prefer to set theDataContextin XAML.
Populate chart with data
As we are going to visualize the data from the model, add ColumnSeries3D to SfChart3D.Series property, and then bind the Data property of the above ViewModel to the ColumnSeries3D.ItemsSource property as follows.
N You need to set
XBindingPathandYBindingPathproperties, so thatSfChart3Dwould fetch values from the respective properties in the data model to plot the series.
<chart:SfChart3D
     x:Name="Chart3D"
     Width="500"
     Height="500">

     <!-- PrimaryAxis -->
     <chart:SfChart3D.PrimaryAxis>
         <chart:DateTimeAxis3D/>
     </chart:SfChart3D.PrimaryAxis>

     <!-- SecondaryAxis -->
     <chart:SfChart3D.SecondaryAxis>
         <chart:NumericalAxis3D/>
     </chart:SfChart3D.SecondaryAxis>

     <chart:ColumnSeries3D
         ItemsSource="{Binding UsersList}"
         XBindingPath="TimeStamp"
         YBindingPath="NoOfUsers">
     </chart:ColumnSeries3D>

 </chart:SfChart3D>
SfChart3D chart3D = new SfChart3D();
chart3D.PrimaryAxis = new DateTimeAxis3D();
chart3D.SecondaryAxis = new NumericalAxis3D();
ColumnSeries3D series = new ColumnSeries3D()
{
ItemsSource = new UsersViewModel().UsersList,
XBindingPath = "TimeStamp",
YBindingPath = "NoOfUsers"
};
chart3D.Series.Add(series);Add title
The header of the chart acts as the title to provide users with quick information about the data being plotted in the chart. You can set the title using the Header property of the chart as follows.
<Grid>
    <chart:SfChart3D Header="Chart"></chart:SfChart3D>
</Grid>
// Initialize the chart with header as shown for code brevity.
SfChart3D chart = new SfChart3D()
{
Header = "Chart"
};Enable data labels
You can add data labels to improve the readability of the chart and it can be enabled using AdornmentsInfo property of ChartSeries3D. By default, no label is displayed; you have to set the ShowLabel property of ChartAdornmentInfo3D to True.
<Grid>
    <chart:SfChart3D>
        ...
        <chart:ColumnSeries3D
            ItemsSource="{Binding UsersList}"
            XBindingPath="TimeStamp"
            YBindingPath="NoOfUsers">
            <chart:ColumnSeries3D.AdornmentsInfo>
                <chart:ChartAdornmentInfo3D ShowLabel="True"></chart:ChartAdornmentInfo3D>
            </chart:ColumnSeries3D.AdornmentsInfo>
        </chart:ColumnSeries3D>
        ...
    </chart:SfChart3D>
</Grid>series.AdornmentsInfo = new ChartAdornmentInfo3D()
{
ShowLabel = true
};Refer to Adornments to learn more about the options to customize chart adornments.
Enable legend
You can enable legend using the Legend property as follows.
<Grid>
<chart:SfChart3D>
...
<!--Legend-->
<chart:SfChart3D.Legend>
<chart:ChartLegend></chart:ChartLegend>
</chart:SfChart3D.Legend>
...
</chart:SfChart3D>
</Grid>chart.Legend = new ChartLegend();Additionally, you need to set a label for each series using the Label property of ChartSeries, which will be displayed in the corresponding legend.
<chart:SfChart3D>
...
<chart:ColumnSeries3D
Label="UserProfile"
ItemsSource="{Binding UsersList}"
XBindingPath="TimeStamp"
YBindingPath="NoOfUsers">
</chart:ColumnSeries3D>
...
</chart:SfChart3D>ColumnSeries3D series = new ColumnSeries3D()
{
ItemsSource = new UsersViewModel().UsersList,
XBindingPath = "TimeStamp",
YBindingPath = "NoOfUsers",
Label = "UserProfile"
};Enable tooltip
Tooltips are used to show information about the segment when you click the segment. You can enable tooltip by setting the series ShowTooltip property to true.
<chart:SfChart3D>
...
<chart:ColumnSeries3D
Label="UserProfile"
ItemsSource="{Binding UsersList}"
XBindingPath="TimeStamp"
YBindingPath="NoOfUsers"
ShowTooltip="True">
</chart:ColumnSeries3D>
...
</chart:SfChart3D>ColumnSeries3D series = new ColumnSeries3D()
{
ItemsSource = new UsersViewModel().UsersList,
XBindingPath = "TimeStamp",
YBindingPath = "NoOfUsers",
Label = "UserProfile",
ShowTooltip = true,
};The following code example gives you the complete code of the above configurations.
<Window x:Class="GettingStarted_3DCharts.MainWindow"
xmlns="http://schemas.microsoft.com/winfx/2006/xaml/presentation"
xmlns:x="http://schemas.microsoft.com/winfx/2006/xaml"
xmlns:d="http://schemas.microsoft.com/expression/blend/2008"
xmlns:mc="http://schemas.openxmlformats.org/markup-compatibility/2006"
xmlns:chart="clr-namespace:Syncfusion.UI.Xaml.Charts;assembly=Syncfusion.SfChart.WPF"
xmlns:local="clr-namespace:GettingStarted_3DCharts"
mc:Ignorable="d"
Title="MainWindow" Height="450" Width="800">
<Window.DataContext>
<local:UsersViewModel/>
</Window.DataContext>
<Grid>
<chart:SfChart3D
x:Name="Chart3D"
Width="500"
Height="500"
Header="Chart">
<!--PrimaryAxis-->
<chart:SfChart3D.PrimaryAxis>
<chart:DateTimeAxis3D/>
</chart:SfChart3D.PrimaryAxis>
<!--SecondaryAxis-->
<chart:SfChart3D.SecondaryAxis>
<chart:NumericalAxis3D/>
</chart:SfChart3D.SecondaryAxis>
<!--Legend-->
<chart:SfChart3D.Legend>
<chart:ChartLegend/>
</chart:SfChart3D.Legend>
<chart:ColumnSeries3D
Label="UserProfile"
ItemsSource="{Binding UsersList}"
XBindingPath="TimeStamp"
YBindingPath="NoOfUsers"
ShowTooltip="True">
<!--Adornments-->
<chart:ColumnSeries3D.AdornmentsInfo>
<chart:ChartAdornmentInfo3D ShowLabel="True"/>
</chart:ColumnSeries3D.AdornmentsInfo>
</chart:ColumnSeries3D>
</chart:SfChart3D>
</Grid>
</Window>SfChart3D chart = new SfChart3D()
{
Header = "Chart",
Height = 500,
Width = 500
};
//Adding horizontal axis to the chart
DateTimeAxis3D primaryAxis = new DateTimeAxis3D();
primaryAxis.Header = "Time";
primaryAxis.FontSize = 14;
chart.PrimaryAxis = primaryAxis;
//Adding vertical axis to the chart
NumericalAxis3D secondaryAxis = new NumericalAxis3D();
secondaryAxis.Header = "Users";
secondaryAxis.FontSize = 14;
chart.SecondaryAxis = secondaryAxis;
//Adding Legends for the chart
ChartLegend legend = new ChartLegend();
chart.Legend = legend;
//Initializing column series
ColumnSeries3D series = new ColumnSeries3D();
series.ItemsSource = new UsersViewModel().UsersList;
series.XBindingPath = "TimeStamp";
series.YBindingPath = "NoOfUsers";
series.Label = "UserProfile";
//Enable Tooltip
series.ShowTooltip = true;
//Setting adornment to the chart series
series.AdornmentsInfo = new ChartAdornmentInfo3D()
{
    ShowLabel = true
};
//Adding Series to the Chart Series Collection
chart.Series.Add(series);
this.Content = chart;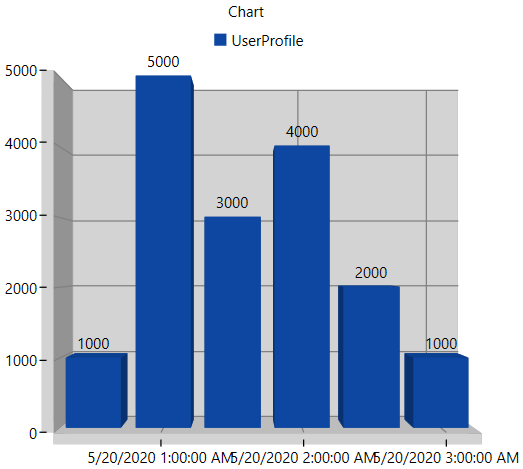
You can find the complete getting started sample from this link.
Theme
SfChart3D supports various built-in themes. Refer to the below links to apply themes for the SfChart3D,