How can I help you?
Chart-Events in WPF Chart (Classic)
5 May 20213 minutes to read
Chart Axis Events
ChartAxis events that could be used to track the Axis changes are as follows.
Axis.Changed
This event is triggered whenever any properties of the axis are changed.
Area.PrimaryAxis.Changed += new EventHandler(PrimaryAxis_Changed);


// PrimaryAxis.Changed Event

void PrimaryAxis_Changed(object sender, EventArgs e)

{

   MessageBox.Show(Area.PrimaryAxis.ToString());

}

Axis.RangeChanged
Both Primary and Secondary Axis comes with Rangechanged event. This event occurs when the Range of the axis is changed. We could get the old and new range from this event.
///<summary>

///Event triggered when Axis range is changed.

///</summary>

///<param name="sender">Sender Axis of event.</param>

///<param name="e">ChartAxisRangeArgument that returns old and new range values.</param>


void PrimaryAxis_RangeChanged(object sender, ChartAxisRangeArgs e)

{

    Console.WriteLine (e.OldValue.Start.ToString();

    Console.WriteLine (e.OldValue.End.ToString();

    Console.WriteLine (e.NewValue.Start.ToString();

    Console.WriteLine (e.NewValue.End.ToString();

}
Chart Series Mouse Events
The following are the mouse events and their corresponding descriptions:
| Event | Description |
|---|---|
| MouseClick | This event is handled when any mouse button is clicked, while mouse pointer is over the series. |
| MouseDown | This event is handled when any mouse button is pressed, while mouse pointer is over the series. |
| MouseEnter | This event is handled when mouse pointer enters the bounds of the series. |
| MouseLeave | This event is handled when mouse pointer leaves the bounds of the series. |
| MouseUp | This event is handled when any mouse button is released over the series. |
| MouseLeftButtonUp | This event is handled when left mouse button is released over the series. |
| MouseLeftButtonDown | This event is handled when left mouse button is pressed over the series. |
| MouseRightButtonUp | This event is handled when right mouse button is released over the series. |
| MouseRightButtonDown | This event is handled when right mouse button is pressed over the series. |
These events can be initialized using the following lines of code.
<sfchart:ChartSeries Data="0 3 1 4 2 5 3 9 6 4 7 3 8 5 9 11" Type="Pie" MouseClick="ChartSeries_MouseClick"

MouseHover="ChartSeries_MouseHover"/>
ChartSeries chartSeries = new ChartSeries();
this.MouseClick += new EventHandler(ChartSeries_MouseClick);
private void ChartSeries_MouseClick(object sender, EventArgs e)
{
// Your code here
}Chart MouseEventArgs
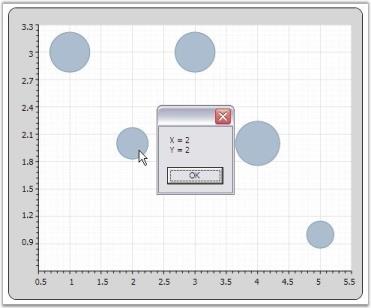
ChartMouseEventArgs are the arguments returned when the mouse events are triggered by ChartSeries. ChartMouseEventArgs returns the segment on which the mouse events are triggered along with default mouse event args. This event args can be used to perform customization of a segment when a mouse event is encountered. The segment returns different values that can be used to perform calculations or operations. The following lines of code demonstrates how ChartMouseEventArgs can be used to retrieve information about the ChartSeries segment.
series.MouseClick += new ChartMouseEventHandler(series_MouseClick);

static void series_MouseClick(object sender, ChartMouseEventArgs e)

{

ChartPoint point = (ChartPoint)e.Segment.CorrespondingPoints[0].DataPoint;

MessageBox.Show("X = " + point.X.ToString() + "\n" + "Y = " + point.Y.ToString());

}