How can I help you?
Annotations in WPF Chart (Classic)
5 May 20216 minutes to read
Annotations in WPF Chart (Classic) at X-Y Coordinates
Annotations at specific X-Y coordinates can be added to the chart programmatically. The ChartSeriesAnnotation type used to define an annotation provides these properties:
| ChartSeriesAnnotation Property | Description |
|---|---|
| Description | String description of the annotation. |
| X | Specifies the x coordinate in the plot. |
| Y | Specifies the y coordinate in the plot. |
| OffsetX | X offset for locating the annotation. |
| OffsetY | Y offset for locating the annotation. |
| Template | Apecifies the look and feel of a specific annotation instance. |
The AnnotationsCollection type, which is the container for the above ChartSeriesAnnotation instances, provides some properties that are applied on all the annotations:
| AnnotationsCollection Property | Description |
|---|---|
| AnnotationsTemplate | Specifies the look and feel for all the annotations in the ChartSeries. |
| LineColor | Specifies the color of the line drawn from the location to the annotation, in case OffsetX and OffsetY are specified. |
| IsRelative |
Z and y values above are x-y coordinates of the plotIf true , they are in Chart Area coordinates. Default value isfalse . |
Here is a code example that adds a few annotations to a chart.
<sfchart:ChartSeries Name="series1" Label="Series1" Type="Area" Interior="LightSkyBlue">
<sfchart:ChartSeries.Annotations>
<sfchart:AnnotationsCollection LineColor="White" x:Uid="Annot">
<!--Define the look and feel of the annotation.-->
<sfchart:AnnotationsCollection.AnnotationsTemplate>
<DataTemplate>
<Button Content="{Binding Y}" ToolTip="{Binding Description}" Background="LightGray" Name="Button1"
Click="Button_Click" />
</DataTemplate>
</sfchart:AnnotationsCollection.AnnotationsTemplate>
</sfchart:AnnotationsCollection>
<!--The annotations are added to this collection in code-behind.-->
</sfchart:ChartSeries.Annotations>
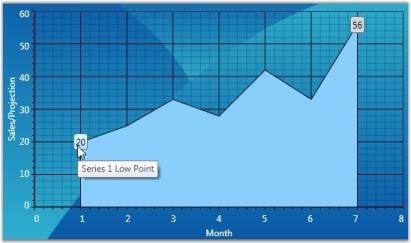
</sfchart:ChartSeries>// Series1 Annotations
ChartSeriesAnnotation ser1LowPoint = new ChartSeriesAnnotation() { X = 1, Y = 20, Description = "Series 1 Low Point" };
ChartSeriesAnnotation ser1HighPoint = new ChartSeriesAnnotation() { X = 7, Y = 56, Description = "Series 1 High Point" };
this.Chart1.Areas[0].Series[0].Annotations.Items.Add(ser1LowPoint);
this.Chart1.Areas[0].Series[0].Annotations.Items.Add(ser1HighPoint);The resultant annotations look like this.
Annotations in WPF Chart (Classic) At Control Coordinates
Chart for WPF also lets you add some annotations to the chart at specific control coordinates. By default, these annotations appear as simple text labels. But, their look and feel can be fully customized using custom templates.
Here are some Chart control properties that let you add annotations at Chart control coordinates:
| Property | Description |
|---|---|
| AnnotationLabels | Collection into which you add the ChartAnnotationLabel instances representing the annotations. |
| AnnotationLabelTemplate | Defines a custom look and feel for the annotation. |
The ChartAnnotationLabel type used to define an annotation exposes these properties.
| ChartAnnotationLabel Property | Description |
|---|---|
| Content | Content that needs to be displayed in the annotation (usually a string). |
| OffsetX | X offset from the top-left of the control used to determine the x-location of the annotation. |
| OffsetY | Y offset from the top-left of the control used to determine the y-location of the annotation. |
Here is some code example that shows how to add annotations at Chart coordinates and how to customize their look and feel.
<syncfusion:Chart Name="chart1">


   <!--Template defining the custom look and feel of the annotations.-->

    <syncfusion:Chart.AnnotationLabelTemplate>

        <DataTemplate>

            <Border Background="MintCream"  BorderBrush="Black" BorderThickness="1">

                <TextBlock Text="{Binding}" Foreground="Black" FontFamily="Tahoma" FontSize="12"  Margin="5"/>

            </Border>

        </DataTemplate>

    </syncfusion:Chart.AnnotationLabelTemplate>

    <syncfusion:Chart.AnnotationLabels>

        <syncfusion:ChartAnnotationLabelsCollection>


            <!--ChartAnnotationLabel instance representing the location and content of the annotation.-->

            <syncfusion:ChartAnnotationLabel x:Name="label1"  Content="Top 6 Products" OffsetX="50" OffsetY="60">

            </syncfusion:ChartAnnotationLabel>

        </syncfusion:ChartAnnotationLabelsCollection>

    </syncfusion:Chart.AnnotationLabels>

</syncfusion:Chart>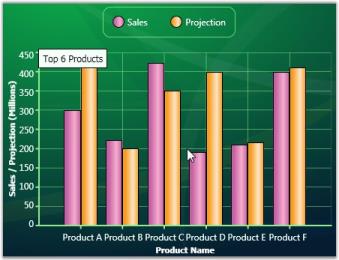
Annotation Shapes
Predefined shapes for annotation objects are used to point at specific information about a position in the chart. For example: Circle, Arrow etc.
The following table describes more about the annotation shapes:
| Name of the Property | Type of Property | Values It accepts |
|---|---|---|
| Content | Dependency Property | String |
| AnnotationShape | Dependency Property | Enum of type AnnotationShapes |
| Fill | Dependency Property | Colors from brushes |
| Offset X | Dependency Property | Double value |
| Offset Y | Dependency Property | Double Value |
The Content property helps represent the required content in an annotation shape.
The AnnotationShape property helps create the required shape for an annotation object and the Fill property helps fill the selected shape with required color.
The following code example illustrates the creation of predefined annotation shape for a Chart.
<syncfusion:Chart.AnnotationsLabel>
<syncfusion:ChartAnnotationLabelsCollection>
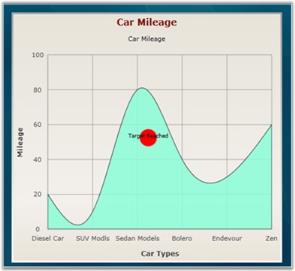
<syncfusion:ChartAnnotationLabel x:Name="Annotlabel" Content="Target Reached" OffsetY="200" OffsetX="200" AnnotationShape="Circle" Fill="Red"/>
</syncfusion:ChartAnnotationLabelsCollection>
</syncfusion:Chart.AnnotationsLabel>
<syncfusion:ChartArea >Chart1.AnnotationsLabel[0].OffsetX = 200;
Chart1.AnnotationsLabel[0].OffsetY = 200;
Chart1.AnnotationsLabel[0].Content = "TargetReached";
Chart1.AnnotationsLabel[0].AnnotationShape = AnnotationShapes.Circle;
Chart1.AnnotationsLabel[0].AnnotationShape = Red;Run the code. The following output is displayed.
A sample which demonstrates the various predefined annotation shapes in Essential Chart, is available in the following install location:
C:\Documents and Settings<user name>\My Documents\Syncfusion\Essential Studio\ Samples\WPF\Chart.WPF\Samples\3.5\WindowsSamples\Annotations