Linear Gauge in Windows Forms Radial Gauge (Gauge)
9 Jul 202624 minutes to read
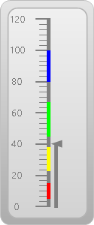
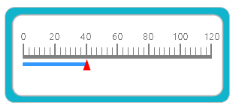
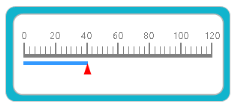
LinearGauge displays a range of values graphically along the linear scale. It measures the values of the scales and can be presented in a horizontal or vertical sliding meter.
Key features
-
Scales - Provides support to customize the appearance of the associated scales.
-
Frame types - Provides options to specify the built-in frame style, such as horizontal or vertical.
-
Range - Provides options to display different ranges in different colors.
-
Customization options - Supports color and visibility customization of all elements and its appearance can also be customized in any form.
-
Visual style - Supports a rich set of visual styles to modify the look and feel of the LinearGauge.
-
Data binding - Support provided to update the value using the data binding concept.
Getting started
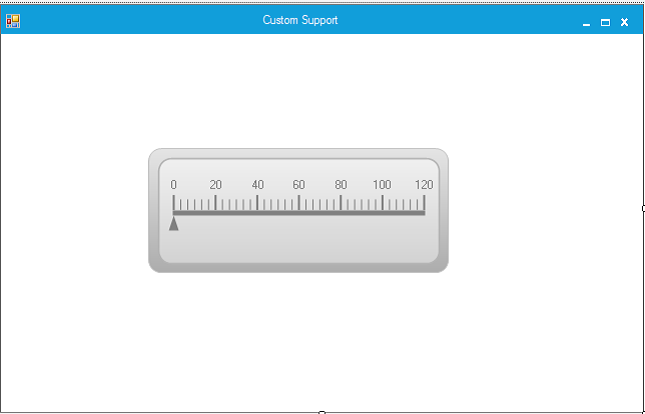
This section describes how to add the LinearGauge control to a Windows Forms application and gives an overview of its basic functionalities.
Assembly deployment
Refer the control dependencies section to get the list of assemblies or NuGet packages that need to be added as a reference to use the control in any application.
For more details on how to install the NuGet packages in a Windows Forms application, refer to the following link:
Creating a simple application with LinearGauge
You can create the Windows Forms application with the LinearGauge control as follows:
Creating the project
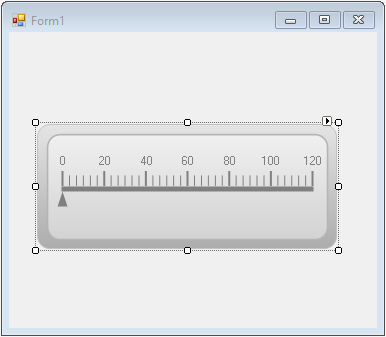
Create a new Windows Forms project in Visual Studio to display the LinearGauge with basic functionalities.
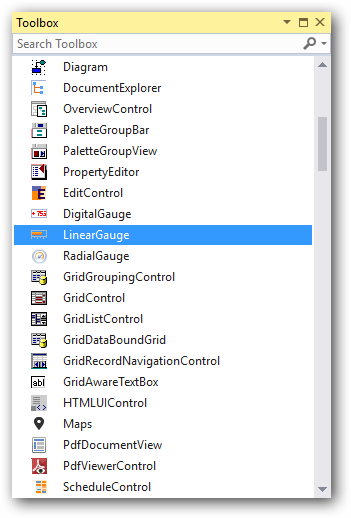
Adding control via designer
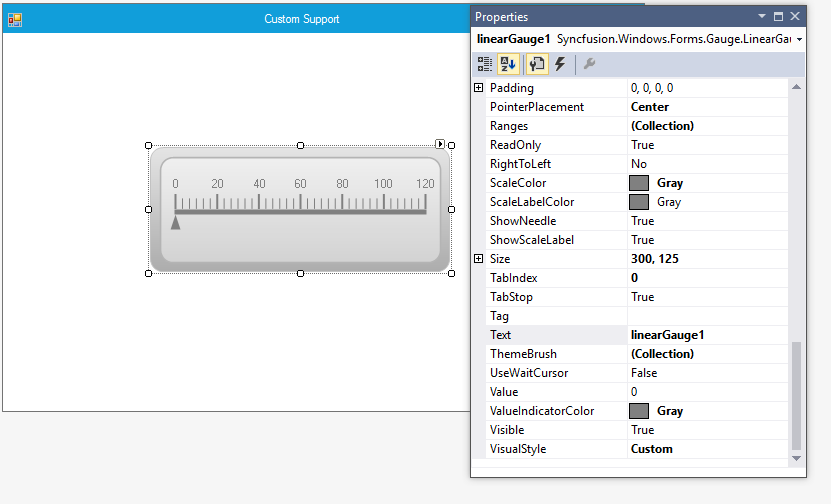
The LinearGauge control can be added to the application by dragging it from the toolbox and dropping it in a designer view. The following required assembly references will be added automatically:
- Syncfusion.Gauge.Windows.dll
- Syncfusion.Shared.Base.dll
Adding control manually using code
To add the control manually in C#, follow the given steps:
Step 1: Add the following required assembly references to the project:
- Syncfusion.Gauge.Windows.dll
- Syncfusion.Shared.Base.dll
Step 2: Include the namespace Syncfusion.Windows.Forms.Gauge.
using Syncfusion.Windows.Forms.Gauge;Imports Syncfusion.Windows.Forms.GaugeStep 3: Create the LinearGauge control instance and add it to the form.
LinearGauge linearGauge1 = new LinearGauge();

this.Controls.Add(linearGauge1);
Dim linearGauge1 As LinearGauge = New LinearGauge
Me.Controls.Add(linearGauge1)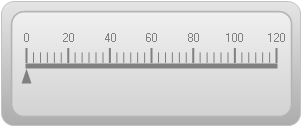
Concepts and features
This section illustrates the features of the LinearGauge with images and sample code. It contains the following topics:
- LinearGauge Frames
- Scales
- Ticks
- Needles
- Ranges
- Scaling Divisions
LinearGauge frame
The frame defines the frame types of linear gauges. Frames can be applied using the LinearFrameType property. The LinearGauge control contains two frame types:
- Horizontal
- Vertical
The following properties are used to customize the appearance of the LinearGauge control:
- LinearFrameType
- BackgroundGradientStartColor
- BackgroundGradientEndColor
- InnerFrameGradientStartColor
- InnerFrameGradientEndColor
- OuterFrameGradientStartColor
- OuterFrameGradientEndColor
- GaugeBaseColor
- ValueIndicatorColor
this.linearGauge1.LinearFrameType = LinearFrameType.Horizontal;Me.linearGauge1.LinearFrameType = LinearFrameType.HorizontalScales
Scales are used to control element placement and value ranges.
Customizing scales
You can customize the scales added to the Linear Gauge by using the following properties:
Ticks
Two types of ticks can be added to the LinearGauge control scale. Major tick marks are the primary scale indicators. Minor tick marks and inter-tick marks are the secondary scale indicators that fall between the major ticks.
The following table lists the properties that can be used to customize the linear tick marks to represent the scale with meaningful markers and labels.
The following code sample demonstrates how to add major and minor ticks to the linear scale.
this.linearGauge1.MajorTickMarkColor = System.Drawing.Color.White;

this.linearGauge1.MinorTickMarkColor = System.Drawing.Color.White;

this.linearGauge1.MinorTickHeight = 6;

this.linearGauge1.MajorTicksHeight = 12;Me.linearGauge1.MajorTickMarkColor = System.Drawing.Color.White
Me.linearGauge1.MinorTickMarkColor = System.Drawing.Color.White
Me.linearGauge1.MinorTickHeight = 6
Me.linearGauge1.MajorTicksHeight = 12Needles
The appearance of the needle can be customized by using the ShowNeedle and NeedleColor properties.
this.linearGauge1.ShowNeedle = true;

this.linearGauge1.NeedleColor = System.Drawing.Color.Black;Me.linearGauge1.ShowNeedle = True
Me.linearGauge1.NeedleColor = System.Drawing.Color.BlackPointer placement
this.linearGauge1.PointerPlacement = Placement.Center;Me.linearGauge1.PointerPlacement = Placement.Center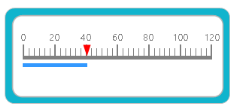
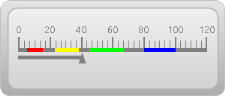
Ranges
Ranges are objects that highlight a range of values and can display different ranges in different colors. Ranges can be customized using various attributes such as range placement, height, color of the range, and more. All the available attributes are listed in the following table:
| Property | Type | Description |
|---|---|---|
| StartValue | Integer | Specify the start value of the range. Default value is set to 0. |
| EndValue | Integer | Specify the end value of the range. Default value is set to 0. |
| RangePlacement | Enum |
Using this attribute, the range can be positioned in two areas along the linear scale. It includes the following options:
The default value is Inside. |
| Height | Integer | Specify the height of the range. Default value is set to 5. |
| Color | Color | Gets or sets the color of the range. |
The following code sample demonstrates how to add ranges to the linear gauge:
Syncfusion.Windows.Forms.Gauge.LinearRange range1 = new Syncfusion.Windows.Forms.Gauge.LinearRange();

range1.Color = System.Drawing.Color.FromArgb(((int)(((byte)(225)))), ((int)(((byte)(128)))), ((int)(((byte)(128)))));

range1.EndValue = 0F;

range1.Height = 5;

range1.InRange = false;

range1.Name = "GaugeRange1";

range1.StartValue = 0F;

this.linearGauge1.Ranges.Add(range1);
Dim range1 As New Syncfusion.Windows.Forms.Gauge.LinearRange()
range1.Color = System.Drawing.Color.FromArgb(CInt(CByte(225)), CInt(CByte(128)), CInt(CByte(128)))
range1.EndValue = 0F
range1.Height = 5
range1.InRange = False
range1.Name = "GaugeRange1"
range1.StartValue = 0F
Me.linearGauge1.Ranges.Add(range1)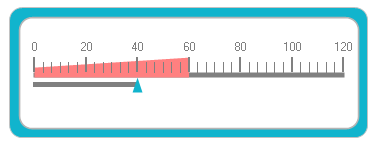
Scaling divisions
The Gauge control for Windows Forms includes support for customizing the number of major tick lines and minor tick lines using the MajorDifference and MinorTickCount properties. It also provides support to customize the number of tick lines using the MaximumValue and MinimumValue properties.
this.linearGauge1.MajorDifference = 20F;

this.linearGauge1.MaximumValue = 120F;

this.linearGauge1.MinimumValue = 0F;

this.linearGauge1.MinorTickCount = 1;Me.linearGauge1.MajorDifference = 20F
Me.linearGauge1.MaximumValue = 120F
Me.linearGauge1.MinimumValue = 0F
Me.linearGauge1.MinorTickCount = 1Visual styles
The Gauge control for Windows Forms includes a rich set of stunning skins for professional representation of gauges. You can easily modify the look and feel of the gauge component using the VisualStyle property.
The styles are built-in for all gauges.
- Blue
- Black
- Silver
- Metro
- Office2016White
- Office2016Colorful
- Office2016DarkGray
- Office2016Black
- Custom
Black
This option helps to set the Black theme.
this.linearGauge1.VisualStyle = Syncfusion.Windows.Forms.Gauge.ThemeStyle.Black;Me.linearGauge1.VisualStyle = Syncfusion.Windows.Forms.Gauge.ThemeStyle.Black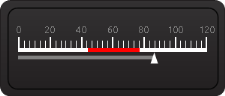
Blue
This option helps to set the Blue theme.
this.linearGauge1.VisualStyle = Syncfusion.Windows.Forms.Gauge.ThemeStyle.Blue;Me.linearGauge1.VisualStyle = Syncfusion.Windows.Forms.Gauge.ThemeStyle.Blue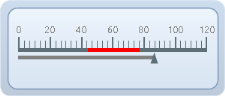
Silver
This option helps to set the Silver theme.
this.linearGauge1.VisualStyle = Syncfusion.Windows.Forms.Gauge.ThemeStyle.Silver;Me.linearGauge1.VisualStyle = Syncfusion.Windows.Forms.Gauge.ThemeStyle.Silver
Metro
This option helps to set the Metro theme.
this.linearGauge1.VisualStyle = Syncfusion.Windows.Forms.Gauge.ThemeStyle.Metro;Me.linearGauge1.VisualStyle = Syncfusion.Windows.Forms.Gauge.ThemeStyle.Metro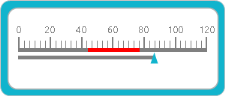
Office2016 White
This option helps to set the Office2016White theme.
//Office2016White

this.linearGauge1.VisualStyle = Syncfusion.Windows.Forms.Gauge.ThemeStyle.Office2016White;
'Office2016White
Me.linearGauge1.VisualStyle = Syncfusion.Windows.Forms.Gauge.ThemeStyle.Office2016White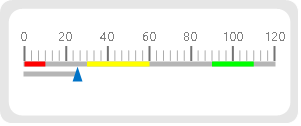
Office2016Colorful
This option helps to set the Office2016Colorful theme.
// Office2016Colorful

this.linearGauge1.VisualStyle = Syncfusion.Windows.Forms.Gauge.ThemeStyle.Office2016Colorful;
'Office2016Colorful
Me.linearGauge1.VisualStyle = Syncfusion.Windows.Forms.Gauge.ThemeStyle.Office2016Colorful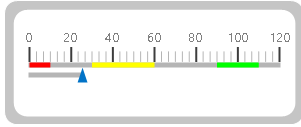
Office2016DarkGray
This option helps to set the Office2016DarkGray theme.
//Office2016DarkGray

this.linearGauge1.VisualStyle = Syncfusion.Windows.Forms.Gauge.ThemeStyle.Office2016DarkGray;
'Office2016DarkGray
Me.linearGauge1.VisualStyle = Syncfusion.Windows.Forms.Gauge.ThemeStyle.Office2016DarkGray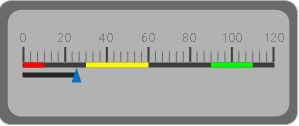
Office2016Black
This option helps to set the Office2016Black theme.
//Office2016Black

this.linearGauge1.VisualStyle = Syncfusion.Windows.Forms.Gauge.ThemeStyle.Office2016Black;
'Office2016Black
Me.linearGauge1.VisualStyle = Syncfusion.Windows.Forms.Gauge.ThemeStyle.Office2016Black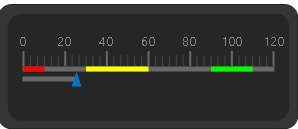
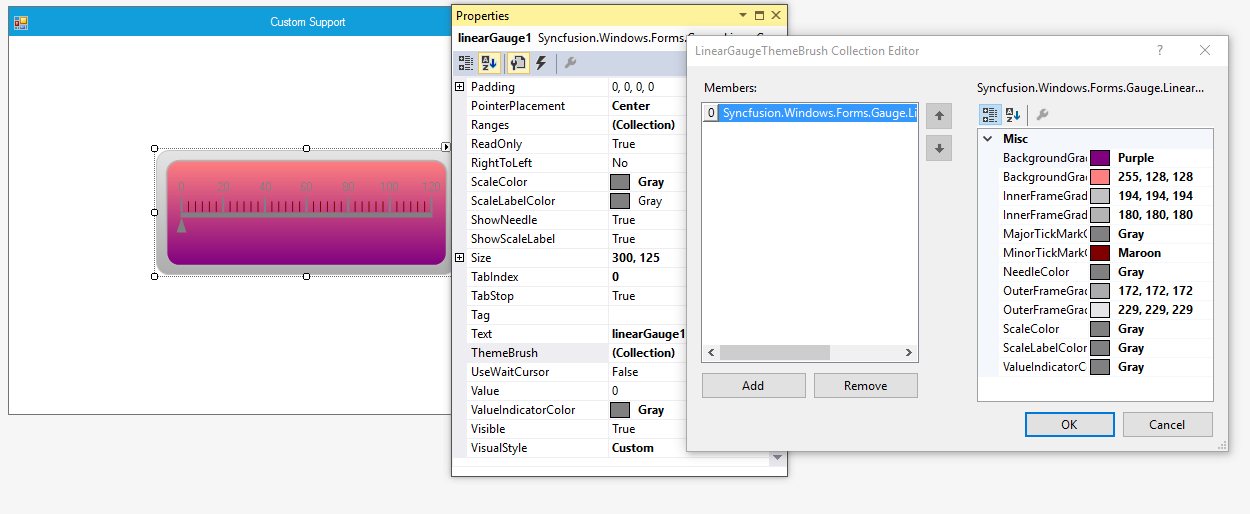
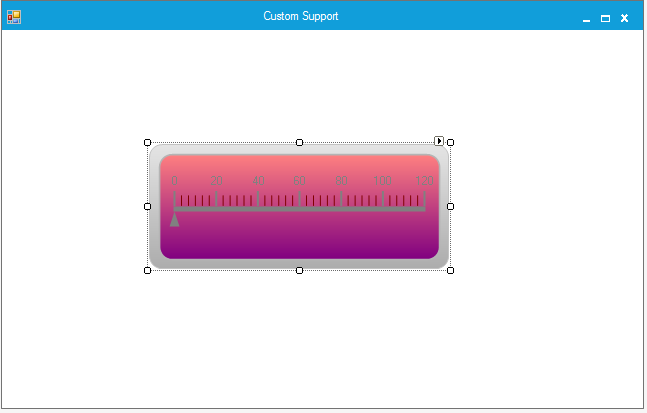
Custom
The Linear Gauge also provides an option to the end user to create their own custom theme based on the requirement by setting the VisualStyle property as Custom.
Steps to customize the theme at design time
Step 1: Add the Linear Gauge control to the Form Designer.
Step 2: Set the VisualStyle as Custom.
Step 3: Add the necessary theme combination in the ThemeBrush collection and it will update the color customization details in the LinearGauge control.
this.linearGauge1 = new Syncfusion.Windows.Forms.Gauge.LinearGauge();
this.linearGauge1.BackgroundGradientEndColor = System.Drawing.Color.Purple;
this.linearGauge1.BackgroundGradientStartColor = System.Drawing.Color.FromArgb(((int)(((byte)(255)))), ((int)(((byte)(128)))), ((int)(((byte)(128)))));
this.linearGauge1.ForeColor = System.Drawing.Color.Gray;
this.linearGauge1.GaugelabelFont = new System.Drawing.Font("Segoe UI", 8.25F, System.Drawing.FontStyle.Regular, System.Drawing.GraphicsUnit.Point, ((byte)(0)));
this.linearGauge1.LinearFrameType = Syncfusion.Windows.Forms.Gauge.LinearFrameType.Horizontal;
this.linearGauge1.Location = new System.Drawing.Point(138, 109);
this.linearGauge1.MajorTicksHeight = 15;
this.linearGauge1.MinimumSize = new System.Drawing.Size(75, 125);
this.linearGauge1.MinorTickCount = 5;
this.linearGauge1.MinorTickHeight = 10;
this.linearGauge1.MinorTickMarkColor = System.Drawing.Color.Maroon;
this.linearGauge1.Name = "linearGauge1";
this.linearGauge1.PointerPlacement = Syncfusion.Windows.Forms.Gauge.Placement.Center;
this.linearGauge1.ScaleColor = System.Drawing.Color.Gray;
this.linearGauge1.Size = new System.Drawing.Size(300, 125);
this.linearGauge1.TabIndex = 0;
this.linearGauge1.Text = "linearGauge1";
this.linearGauge1.ValueIndicatorColor = System.Drawing.Color.Gray;
this.linearGauge1.VisualStyle = Syncfusion.Windows.Forms.Gauge.ThemeStyle.Custom;Me.linearGauge1 = New Syncfusion.Windows.Forms.Gauge.LinearGauge()
Me.linearGauge1.BackgroundGradientEndColor = System.Drawing.Color.Purple
Me.linearGauge1.BackgroundGradientStartColor = System.Drawing.Color.FromArgb((CType(((CType((255), Byte))), Integer)), (CType(((CType((128), Byte))), Integer)), (CType(((CType((128), Byte))), Integer)))
Me.linearGauge1.ForeColor = System.Drawing.Color.Gray
Me.linearGauge1.GaugelabelFont = New System.Drawing.Font("Segoe UI", 8.25F, System.Drawing.FontStyle.Regular, System.Drawing.GraphicsUnit.Point, (CType((0), Byte)))
Me.linearGauge1.LinearFrameType = Syncfusion.Windows.Forms.Gauge.LinearFrameType.Horizontal
Me.linearGauge1.Location = New System.Drawing.Point(138, 109)
Me.linearGauge1.MajorTicksHeight = 15
Me.linearGauge1.MinimumSize = New System.Drawing.Size(75, 125)
Me.linearGauge1.MinorTickCount = 5
Me.linearGauge1.MinorTickHeight = 10
Me.linearGauge1.MinorTickMarkColor = System.Drawing.Color.Maroon
Me.linearGauge1.Name = "linearGauge1"
Me.linearGauge1.PointerPlacement = Syncfusion.Windows.Forms.Gauge.Placement.Center
Me.linearGauge1.ScaleColor = System.Drawing.Color.Gray
Me.linearGauge1.Size = New System.Drawing.Size(300, 125)
Me.linearGauge1.TabIndex = 0
Me.linearGauge1.Text = "linearGauge1"
Me.linearGauge1.ValueIndicatorColor = System.Drawing.Color.Gray
Me.linearGauge1.VisualStyle = Syncfusion.Windows.Forms.Gauge.ThemeStyle.CustomOutput:
Data binding
You can bind any data source to the LinearGauge control and map an index of a record to represent the actual value in the linear gauge. The DisplayMember and DisplayRecordIndex properties will map the DataColumn and DataRow of the binding source respectively to the LinearGauge control, which will then support high-frequency data updates.
this.linearGauge1.DataSource = dataTable;
this.linearGauge1.DisplayRecordIndex = [Row Index];
this.linearGauge1.DisplayMember = [column name];Me.linearGauge1.DataSource = dataTable
Me.linearGauge1.DisplayRecordIndex = [Row Index]
Me.linearGauge1.DisplayMember = [column name]Custom renderer
The appearance of the Linear Gauge can be customized by using the ILinearGaugeRenderer interface. This interface provides a few methods to control painting over the Frame, Needle, Major ticks, Minor ticks, Pointers, Ranges, etc.
To customize the appearance,
- Create a new custom renderer class and implement each of the members defined in ILinearGaugeRenderer.
- Assign the instance of your custom renderer to the Renderer property of the Linear Gauge.
NOTE
By default, the Linear Gauge is painted by using its default renderer.
CustomRenderer custom1 = new CustomRenderer(this.linearGauge1);

linearGauge1.Renderer = custom1;
Private custom1 As CustomRenderer = New CustomRenderer(Me.linearGauge1)
linearGauge1.Renderer = custom1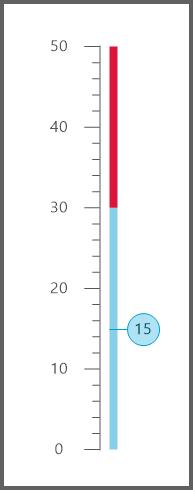
Frequently asked questions
How to customize Linear Gauge appearance
You can customize the appearance of the Linear Gauge by using its interface named ILinearGaugeRenderer and the property named Renderer. The following code example illustrates how to customize the appearance of the Linear Gauge based on user requirements.
CustomRenderer custom1 = new CustomRenderer(this.linearGauge1);

linearGauge1.Renderer = custom1;


class CustomRenderer : ILinearGaugeRenderer
    {

        /// </summary>
        /// Gets the Linear gauge
        /// </summary>
        private LinearGauge m_LinearGauge;
        /// <summary>
        /// Gets/Sets the Tick Distance of the Linear gauge.
        /// </summary>
        private float majorTicksDistance;
        /// <summary>
        /// Calculates the Minor Ticks Pixels.
        /// </summary>
        private float m_minorTicksPixels;
        /// <summary>
        /// Start point of the frame
        /// </summary>
        private int start;
        /// <summary>
        /// Counts the Major ticks count for the given range.
        /// </summary>
        private int majorTicksCount;

        /// <summary>
        ///  Gets the Radial gauge
        /// </summary>
        internal LinearGauge LinearGauge
        {
            get
            {
                return m_LinearGauge;
            }
        }

        public CustomRenderer(LinearGauge linearGauge)
        {
            m_LinearGauge = linearGauge;
            majorTicksDistance = 0;
            m_minorTicksPixels = 0;
            start = 25;

        }

        public void DrawFrame(System.Drawing.Graphics Graphics)
        {
        }

        public void DrawLines(System.Drawing.Graphics Graphics)
        {
            Pen majorTickPen = new Pen(LinearGauge.MajorTickMarkColor);
            Pen minorTickPen = new Pen(LinearGauge.MinorTickMarkColor);
            Brush brush = new SolidBrush(LinearGauge.ForeColor);
            StringFormat sf = new StringFormat();
            Graphics.SmoothingMode = System.Drawing.Drawing2D.SmoothingMode.AntiAlias;

            majorTicksDistance = ((LinearGauge.MaximumValue - LinearGauge.MinimumValue) / LinearGauge.MajorDifference);
            majorTicksCount = ((int)(LinearGauge.MaximumValue - LinearGauge.MinimumValue) / (LinearGauge.MajorDifference)) + 1;
            double majorTickValue = LinearGauge.MinimumValue;
            float tickPosition = 25f;
            float temp1 = 0;
            float s = (LinearGauge.MaximumValue - LinearGauge.MinimumValue) % LinearGauge.MajorDifference;
            sf.Alignment = StringAlignment.Center;
            sf.LineAlignment = StringAlignment.Center;
            float minortickValue = 0;
            float tickPositionMinor = 0;
            GraphicsPath path = new GraphicsPath();
            int minor = LinearGauge.MinorTickCount;
            m_minorTicksPixels = ((this.LinearGauge.Height - 50) / majorTicksDistance);
            int x = this.LinearGauge.Width / 2;
            temp1 = 0;
            for (int L = 1; L <= majorTicksCount; L++)
            {
                Graphics.DrawLine(majorTickPen, x, this.LinearGauge.Height - tickPosition, x - LinearGauge.MajorTicksHeight, this.LinearGauge.Height - tickPosition);
                Graphics.TextRenderingHint = System.Drawing.Text.TextRenderingHint.AntiAlias;
                if (LinearGauge.ShowScaleLabel)
                    Graphics.DrawString(Math.Round(majorTickValue, 2).ToString(),
                             LinearGauge.Font, brush, new PointF(x - LinearGauge.MajorTicksHeight - 25, this.LinearGauge.Height - tickPosition), sf);
                if (L == majorTicksCount)
                    minor = (LinearGauge.MinorTickCount * (int)Math.Ceiling(s)) / LinearGauge.MajorDifference;
                if (majorTickValue < LinearGauge.MaximumValue)
                {
                    for (int S = 1; S <= minor; S++)
                    {
                        minortickValue = (m_minorTicksPixels / (LinearGauge.MinorTickCount + 1)) * S;
                        tickPositionMinor = this.LinearGauge.Height - (minortickValue + temp1 + 25);
                        Graphics.DrawLine(minorTickPen, x, (float)tickPositionMinor, x - LinearGauge.MinorTickHeight, (float)tickPositionMinor);
                    }
                    temp1 = m_minorTicksPixels * L;
                }

                majorTickValue += LinearGauge.MajorDifference;
                tickPosition += m_minorTicksPixels;
            }
            Graphics.FillRectangle(new SolidBrush(LinearGauge.GaugeBaseColor), this.LinearGauge.Width / 2, start - 1, 1, (((this.majorTicksDistance)) * m_minorTicksPixels) + 2);
            if (this.LinearGauge.MinimumValue > 0)
                Graphics.FillRectangle(new SolidBrush(LinearGauge.ValueIndicatorColor), this.LinearGauge.Width / 2 + 10, start + (majorTicksDistance * m_minorTicksPixels) - (((LinearGauge.Value / LinearGauge.MajorDifference)) * m_minorTicksPixels), 5, (((LinearGauge.Value / LinearGauge.MajorDifference)) * m_minorTicksPixels) + 2);
            else
                Graphics.FillRectangle(new SolidBrush(LinearGauge.ValueIndicatorColor), this.LinearGauge.Width / 2 + 10, start + (majorTicksDistance * m_minorTicksPixels) - ((((Math.Abs(this.LinearGauge.MinimumValue) + LinearGauge.Value) / LinearGauge.MajorDifference)) * m_minorTicksPixels), 5, ((((Math.Abs(this.LinearGauge.MinimumValue) + LinearGauge.Value) / LinearGauge.MajorDifference)) * m_minorTicksPixels) + 2);
            brush.Dispose();
            minorTickPen.Dispose();
        }

        public void DrawRanges(System.Drawing.Graphics Graphics)
        {
            Graphics.SmoothingMode = System.Drawing.Drawing2D.SmoothingMode.AntiAlias;
            foreach (LinearRange ptrRange in this.LinearGauge.Ranges)
            {
                int value = (int)Math.Ceiling(LinearGauge.MaximumValue - ptrRange.EndValue) / LinearGauge.MajorDifference;
                if (ptrRange.EndValue > ptrRange.StartValue && ptrRange.EndValue <= this.LinearGauge.MaximumValue)
                {
                    if (this.LinearGauge.MinimumValue >= 0 && ptrRange.StartValue < 0)
                    {
                        return;
                    }
                    float startValue = (float)ptrRange.StartValue;
                    float endValue = (float)ptrRange.EndValue;
                    if (this.LinearGauge.MinimumValue < 0)
                    {
                        startValue = this.LinearGauge.MinimumValue + Math.Abs(ptrRange.StartValue);
                    }
                    if (this.LinearGauge.MinimumValue < 0 && ptrRange.StartValue > 0)
                    {
                        startValue = Math.Abs(this.LinearGauge.MinimumValue) + Math.Abs(ptrRange.StartValue);
                    }
                    if (this.LinearGauge.MinimumValue < 0 && ptrRange.StartValue == 0)
                    {
                        startValue = Math.Abs(this.LinearGauge.MinimumValue) + Math.Abs(ptrRange.StartValue);
                        startValue = (((startValue / LinearGauge.MajorDifference)) * m_minorTicksPixels);
                    }

                    float height = (ptrRange.EndValue / LinearGauge.MajorDifference) * m_minorTicksPixels;
                    float endValueRangeHeight = 0f;
                    if (this.LinearGauge.MinimumValue < 0)
                    {
                        height = ((Math.Abs(this.LinearGauge.MinimumValue) + ptrRange.EndValue) / LinearGauge.MajorDifference) * m_minorTicksPixels;
                    }
                    endValueRangeHeight = height;
                    if (this.LinearGauge.MinimumValue < 0 && ptrRange.StartValue == 0)
                    {
                        endValueRangeHeight = (((ptrRange.EndValue - ptrRange.StartValue) / LinearGauge.MajorDifference) * m_minorTicksPixels);
                    }
                    if (ptrRange.StartValue == 0)
                        Graphics.FillRectangle(new SolidBrush(ptrRange.Color), this.LinearGauge.Width / 2 + 10, start + (majorTicksDistance * m_minorTicksPixels) - height, 8, endValueRangeHeight);
                    else if (ptrRange.StartValue > 0)
                        Graphics.FillRectangle(new SolidBrush(ptrRange.Color), this.LinearGauge.Width / 2 + 10, start + (majorTicksDistance * m_minorTicksPixels) - height, 8, (((ptrRange.EndValue - ptrRange.StartValue) / LinearGauge.MajorDifference) * m_minorTicksPixels));
                    else if (ptrRange.StartValue < 0)
                    {
                        Graphics.FillRectangle(new SolidBrush(ptrRange.Color), this.LinearGauge.Width / 2 + 10, start + (majorTicksDistance * m_minorTicksPixels) - height, 8, (((ptrRange.EndValue - ptrRange.StartValue) / LinearGauge.MajorDifference) * m_minorTicksPixels));
                    }
                }
            }
        }

        public void DrawPointer(System.Drawing.Graphics Graphics)
        {
            Graphics.SmoothingMode = System.Drawing.Drawing2D.SmoothingMode.AntiAlias;
            GraphicsPath path = new GraphicsPath();
            int a = 0;
            if (this.LinearGauge.MinimumValue < 0)
                a = (int)Math.Ceiling((((Math.Abs(this.LinearGauge.MinimumValue) + LinearGauge.Value) / (float)LinearGauge.MajorDifference) * m_minorTicksPixels));
            else
                a = (int)Math.Ceiling(((LinearGauge.Value / (float)LinearGauge.MajorDifference) * m_minorTicksPixels));
            int y = (this.LinearGauge.Height / 2 + 5 + LinearGauge.MajorTicksHeight) - LinearGauge.MajorTicksHeight;
            a = 10 + (int)Math.Ceiling((majorTicksDistance * m_minorTicksPixels))-a;
            Rectangle rect = new Rectangle(new Point(this.LinearGauge.Width / 2 + 28, a), new Size(32, 32));
            SizeF sf= Graphics.MeasureString(this.LinearGauge.Value.ToString(),this.LinearGauge.GaugelabelFont);
            PointF point=new PointF(rect.X+rect.Width/2-sf.Width/2,rect.Y+rect.Height/2-sf.Height/2);
            Graphics.FillEllipse(new SolidBrush(LinearGauge.NeedleColor), rect);
            Graphics.DrawEllipse(new Pen(ColorTranslator.FromHtml("#00a0d1")), rect);
            Graphics.DrawLine(new Pen(ColorTranslator.FromHtml("#00a0d1")), rect.X, rect.Y + rect.Height / 2, rect.X - 18, rect.Y + rect.Height / 2);
            Graphics.DrawString(Math.Round(LinearGauge.Value,2).ToString(), this.LinearGauge.GaugelabelFont, new SolidBrush( ColorTranslator.FromHtml("#024e60")), point);
        }

        public void UpdateRenderer(System.Windows.Forms.PaintEventArgs PaintEventArgs)
        {
            DrawLines(PaintEventArgs.Graphics);
            DrawRanges(PaintEventArgs.Graphics);
            DrawPointer(PaintEventArgs.Graphics);
        }
    }
Private custom1 As CustomRenderer = New CustomRenderer(Me.linearGauge1)
linearGauge1.Renderer = custom1
Public Class CustomRenderer
Implements ILinearGaugeRenderer
''' </summary>
''' Gets the Linear gauge
''' </summary>
Private m_LinearGauge As LinearGauge
''' <summary>
''' Gets/Sets the Tick Distance of the Linear gauge.
''' </summary>
Private majorTicksDistance As Single
''' <summary>
''' Calculates the Minor Ticks Pixels.
''' </summary>
Private m_minorTicksPixels As Single
''' <summary>
''' Start point of the frame
''' </summary>
Private start As Integer
''' <summary>
''' Counts the Major ticks count for the given range.
''' </summary>
Private majorTicksCount As Integer
''' <summary>
''' Gets the Radial gauge
''' </summary>
Friend ReadOnly Property LinearGauge() As LinearGauge
Get
Return m_LinearGauge
End Get
End Property
Public Sub New(ByVal linearGauge As LinearGauge)
m_LinearGauge = linearGauge
majorTicksDistance = 0
m_minorTicksPixels = 0
start = 25
End Sub
Public Sub DrawFrame(ByVal Graphics As System.Drawing.Graphics)
End Sub
Public Sub DrawLines(ByVal Graphics As System.Drawing.Graphics)
Dim majorTickPen As New Pen(LinearGauge.MajorTickMarkColor)
Dim minorTickPen As New Pen(LinearGauge.MinorTickMarkColor)
Dim brush As Brush = New SolidBrush(LinearGauge.ForeColor)
Dim sf As New StringFormat()
Graphics.SmoothingMode = System.Drawing.Drawing2D.SmoothingMode.AntiAlias
majorTicksDistance = ((LinearGauge.MaximumValue - LinearGauge.MinimumValue) / LinearGauge.MajorDifference)
majorTicksCount = (CInt(Fix(LinearGauge.MaximumValue - LinearGauge.MinimumValue)) / (LinearGauge.MajorDifference)) + 1
Dim majorTickValue As Double = LinearGauge.MinimumValue
Dim tickPosition As Single = 25.0F
Dim temp1 As Single = 0
Dim s As Single = (LinearGauge.MaximumValue - LinearGauge.MinimumValue) Mod LinearGauge.MajorDifference
sf.Alignment = StringAlignment.Center
sf.LineAlignment = StringAlignment.Center
Dim tick As Single = 0
Dim tickPositionMinor As Single = 0
Dim path As New GraphicsPath()
Dim minor As Integer = LinearGauge.MinorTickCount
m_minorTicksPixels = ((Me.LinearGauge.Height - 50) / majorTicksDistance)
Dim x As Integer = Me.LinearGauge.Width \ 2
temp1 = 0
For L As Integer = 1 To majorTicksCount
Graphics.DrawLine(majorTickPen, x, Me.LinearGauge.Height - tickPosition, x - LinearGauge.MajorTicksHeight, Me.LinearGauge.Height - tickPosition)
Graphics.TextRenderingHint = System.Drawing.Text.TextRenderingHint.AntiAlias
If LinearGauge.ShowScaleLabel Then
Graphics.DrawString(Math.Round(majorTickValue, 2).ToString(), LinearGauge.Font, brush, New PointF(x - LinearGauge.MajorTicksHeight - 25, Me.LinearGauge.Height - tickPosition), sf)
End If
If L = majorTicksCount Then
minor = (LinearGauge.MinorTickCount * CInt(Fix(Math.Ceiling(s)))) / LinearGauge.MajorDifference
End If
If majorTickValue < LinearGauge.MaximumValue Then
'INSTANT VB NOTE: The variable S was renamed since Visual Basic will not allow local variables with the same name as parameters or other local variables:
For S_Renamed As Integer = 1 To minor
tick = (m_minorTicksPixels / (LinearGauge.MinorTickCount + 1)) * S_Renamed
tickPositionMinor = Me.LinearGauge.Height - (tick + temp1 + 25)
Graphics.DrawLine(minorTickPen, x, tickPositionMinor, x - LinearGauge.MinorTickHeight, tickPositionMinor)
Next S_Renamed
temp1 = m_minorTicksPixels * L
End If
majorTickValue += LinearGauge.MajorDifference
tickPosition += m_minorTicksPixels
Next L
Graphics.FillRectangle(New SolidBrush(LinearGauge.GaugeBaseColor), Me.LinearGauge.Width \ 2, start - 1, 1, (((Me.majorTicksDistance)) * m_minorTicksPixels) + 2)
If Me.LinearGauge.MinimumValue > 0 Then
Graphics.FillRectangle(New SolidBrush(LinearGauge.ValueIndicatorColor), Me.LinearGauge.Width \ 2 + 10, start + (majorTicksDistance * m_minorTicksPixels) - (((LinearGauge.Value / LinearGauge.MajorDifference)) * m_minorTicksPixels), 5, (((LinearGauge.Value / LinearGauge.MajorDifference)) * m_minorTicksPixels) + 2)
Else
Graphics.FillRectangle(New SolidBrush(LinearGauge.ValueIndicatorColor), Me.LinearGauge.Width \ 2 + 10, start + (majorTicksDistance * m_minorTicksPixels) - ((((Math.Abs(Me.LinearGauge.MinimumValue) + LinearGauge.Value) / LinearGauge.MajorDifference)) * m_minorTicksPixels), 5, ((((Math.Abs(Me.LinearGauge.MinimumValue) + LinearGauge.Value) / LinearGauge.MajorDifference)) * m_minorTicksPixels) + 2)
End If
brush.Dispose()
minorTickPen.Dispose()
End Sub
Public Sub DrawRanges(ByVal Graphics As System.Drawing.Graphics)
Graphics.SmoothingMode = System.Drawing.Drawing2D.SmoothingMode.AntiAlias
For Each ptrRange As LinearRange In Me.LinearGauge.Ranges
Dim value As Integer = CInt(Fix(Math.Ceiling(LinearGauge.MaximumValue - ptrRange.EndValue))) / LinearGauge.MajorDifference
If ptrRange.EndValue > ptrRange.StartValue AndAlso ptrRange.EndValue <= Me.LinearGauge.MaximumValue Then
If Me.LinearGauge.MinimumValue >= 0 AndAlso ptrRange.StartValue < 0 Then
Return
End If
Dim startValue As Single = ptrRange.StartValue
Dim endValue As Single = ptrRange.EndValue
If Me.LinearGauge.MinimumValue < 0 Then
startValue = Me.LinearGauge.MinimumValue + Math.Abs(ptrRange.StartValue)
End If
If Me.LinearGauge.MinimumValue < 0 AndAlso ptrRange.StartValue > 0 Then
startValue = Math.Abs(Me.LinearGauge.MinimumValue) + Math.Abs(ptrRange.StartValue)
End If
If Me.LinearGauge.MinimumValue < 0 AndAlso ptrRange.StartValue = 0 Then
startValue = Math.Abs(Me.LinearGauge.MinimumValue) + Math.Abs(ptrRange.StartValue)
startValue = (((startValue / LinearGauge.MajorDifference)) * m_minorTicksPixels)
End If
Dim height As Single = (ptrRange.EndValue / LinearGauge.MajorDifference) * m_minorTicksPixels
Dim endValueRangeHeight As Single = 0.0F
If Me.LinearGauge.MinimumValue < 0 Then
height = ((Math.Abs(Me.LinearGauge.MinimumValue) + ptrRange.EndValue) / LinearGauge.MajorDifference) * m_minorTicksPixels
End If
endValueRangeHeight = height
If Me.LinearGauge.MinimumValue < 0 AndAlso ptrRange.StartValue = 0 Then
endValueRangeHeight = (((ptrRange.EndValue - ptrRange.StartValue) / LinearGauge.MajorDifference) * m_minorTicksPixels)
End If
If ptrRange.StartValue = 0 Then
Graphics.FillRectangle(New SolidBrush(ptrRange.Color), Me.LinearGauge.Width \ 2 + 10, start + (majorTicksDistance * m_minorTicksPixels) - height, 8, endValueRangeHeight)
ElseIf ptrRange.StartValue > 0 Then
Graphics.FillRectangle(New SolidBrush(ptrRange.Color), Me.LinearGauge.Width \ 2 + 10, start + (majorTicksDistance * m_minorTicksPixels) - height, 8, (((ptrRange.EndValue - ptrRange.StartValue) / LinearGauge.MajorDifference) * m_minorTicksPixels))
ElseIf ptrRange.StartValue < 0 Then
Graphics.FillRectangle(New SolidBrush(ptrRange.Color), Me.LinearGauge.Width \ 2 + 10, start + (majorTicksDistance * m_minorTicksPixels) - height, 8, (((ptrRange.EndValue - ptrRange.StartValue) / LinearGauge.MajorDifference) * m_minorTicksPixels))
End If
End If
Next ptrRange
End Sub
Public Sub DrawPointer(ByVal Graphics As System.Drawing.Graphics)
Graphics.SmoothingMode = System.Drawing.Drawing2D.SmoothingMode.AntiAlias
Dim path As New GraphicsPath()
Dim a As Integer = 0
If Me.LinearGauge.MinimumValue < 0 Then
a = CInt(Fix(Math.Ceiling((((Math.Abs(Me.LinearGauge.MinimumValue) + LinearGauge.Value) / LinearGauge.MajorDifference) * m_minorTicksPixels))))
Else
a = CInt(Fix(Math.Ceiling(((LinearGauge.Value / LinearGauge.MajorDifference) * m_minorTicksPixels))))
End If
Dim y As Integer = (Me.LinearGauge.Height \ 2 + 5 + LinearGauge.MajorTicksHeight) - LinearGauge.MajorTicksHeight
a = 10 + CInt(Fix(Math.Ceiling((majorTicksDistance * m_minorTicksPixels)))) - a
Dim rect As New Rectangle(New Point(Me.LinearGauge.Width \ 2 + 28, a), New Size(32, 32))
Dim sf As SizeF = Graphics.MeasureString(Me.LinearGauge.Value.ToString(), Me.LinearGauge.GaugelabelFont)
Dim point As New PointF(rect.X + rect.Width \ 2 - sf.Width \ 2, rect.Y + rect.Height \ 2 - sf.Height \ 2)
Graphics.FillEllipse(New SolidBrush(LinearGauge.NeedleColor), rect)
Graphics.DrawEllipse(New Pen(ColorTranslator.FromHtml("#00a0d1")), rect)
Graphics.DrawLine(New Pen(ColorTranslator.FromHtml("#00a0d1")), rect.X, rect.Y + rect.Height \ 2, rect.X - 18, rect.Y + rect.Height \ 2)
Graphics.DrawString(Math.Round(LinearGauge.Value, 2).ToString(), Me.LinearGauge.GaugelabelFont, New SolidBrush(ColorTranslator.FromHtml("#024e60")), point)
End Sub
Public Sub UpdateRenderer(ByVal PaintEventArgs As System.Windows.Forms.PaintEventArgs)
DrawLines(PaintEventArgs.Graphics)
DrawRanges(PaintEventArgs.Graphics)
DrawPointer(PaintEventArgs.Graphics)
End Sub
End Class