How can I help you?
Annotations in UWP Pivot Chart (SfPivotChart)
7 Jan 202517 minutes to read
The SfPivotChart supports annotations that allow you to mark a specific area of interest in the chart area. You can draw custom shapes, specify a text note, and add images with the help of annotations.
You can add an annotation by using the Annotations property in the SfPivotChart. Using this property, varieties of annotations can be added to the chart control. Following are the different types of annotations that are supported by the SfPivotChart:
- Text annotation.
- Image annotation.
- Rectangle annotation.
- Ellipse annotation.
- Line annotation.
- Horizontal line annotation.
- Vertical line annotation.
Text annotation
Text annotations are used to add simple text representation in the chart area of the SfPivotChart. The following code snippet shows how to add text annotation to the SfPivotChart.
<syncfusion:SfPivotChart.Annotations>
<syncfusion:PivotChartAnnotation AnnotationType="TextAnnotation" Text="Text Annotation" X1="2" Y1="150" FontFamily="Times New Roman" FontSize="16" FontWeight="Bold" FontStretch="ExtraExpanded" FontStyle="Italic"/>
</syncfusion:SfPivotChart.Annotations>
var annotation = new PivotChartAnnotation();
annotation.AnnotationType = PivotChartAnnotationType.TextAnnotation;
annotation.Text = "Text Annotation";
annotation.X1 = 2;
annotation.Y1 = 150;
annotation.FontFamily = new FontFamily("Times New Roman");
annotation.FontSize = 16;
annotation.FontWeight = FontWeights.Bold;
annotation.FontStretch = FontStretch.ExtraExpanded;
annotation.FontStyle = FontStyle.Italic;
PivotChart1.Annotations.Add(annotation);Dim annotation = New PivotChartAnnotation()
annotation.AnnotationType = PivotChartAnnotationType.TextAnnotation
annotation.Text = "Text Annotation"
annotation.X1 = 2
annotation.Y1 = 150
annotation.FontFamily = New FontFamily("Times New Roman")
annotation.FontSize = 16
annotation.FontWeight = FontWeights.Bold
annotation.FontStretch = FontStretch.ExtraExpanded
annotation.FontStyle = FontStyle.Italic
PivotChart1.Annotations.Add(annotation)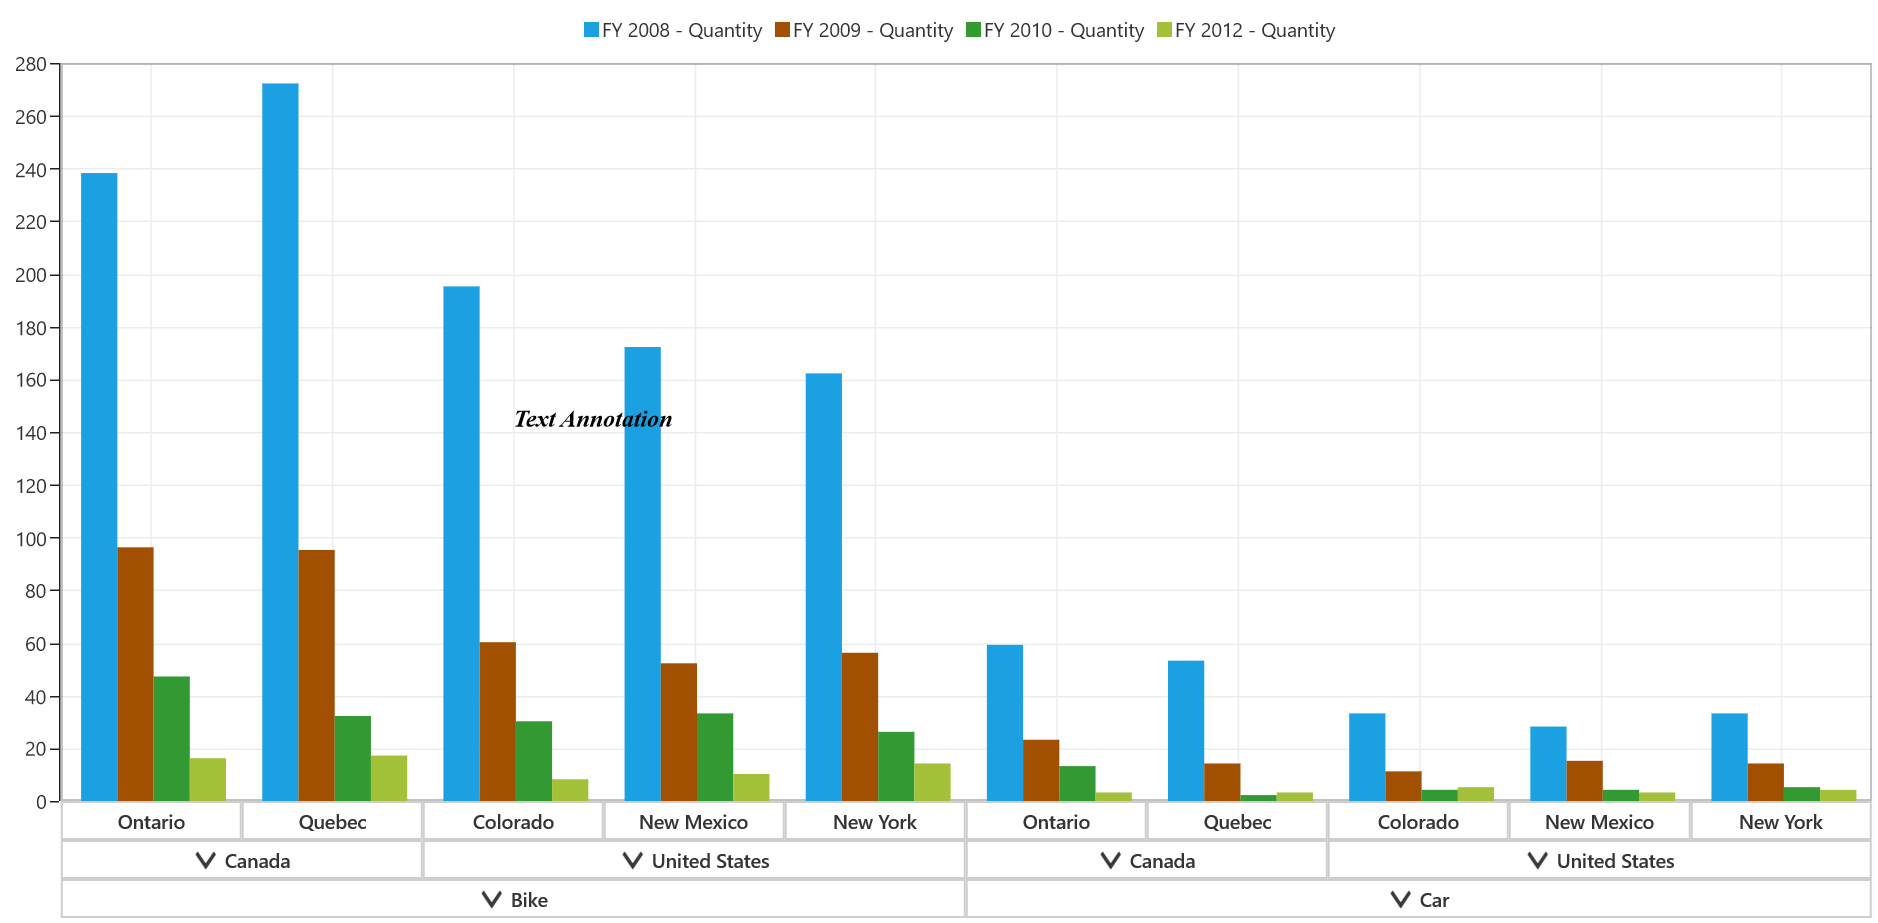
Rotating text annotation
Text annotation can be rotated by using the Angle property. The following code snippet illustrates rotating the text annotation.
<syncfusion:SfPivotChart1.Annotations>
<syncfusion:PivotChartAnnotation AnnotationType="TextAnnotation" Text="Text Annotation" X1="2" Y1="150" Angle="22" FontFamily="Times New Roman" FontSize="16" FontWeight="Bold" FontStretch="ExtraExpanded" FontStyle="Italic"/>
</syncfusion:SfPivotChart1.Annotations>
var annotation = new PivotChartAnnotation();
annotation.AnnotationType = PivotChartAnnotationType.TextAnnotation;
annotation.Text = "Text Annotation";
annotation.X1 = 2;
annotation.Y1 = 150;
annotation.FontFamily = new FontFamily("Times New Roman");
annotation.FontSize = 16;
annotation.FontWeight = FontWeights.Bold;
annotation.FontStretch = FontStretch.ExtraExpanded;
annotation.FontStyle = FontStyle.Italic;
annotation.Angle = 22;
PivotChart1.Annotations.Add(annotation);Dim annotation = New PivotChartAnnotation()
annotation.AnnotationType = PivotChartAnnotationType.TextAnnotation
annotation.Text = "Text Annotation"
annotation.X1 = 2
annotation.Y1 = 150
annotation.FontFamily = New FontFamily("Times New Roman")
annotation.FontSize = 16
annotation.FontWeight = FontWeights.Bold
annotation.FontStretch = FontStretch.ExtraExpanded
annotation.FontStyle = FontStyle.Italic
annotation.Angle = 22
PivotChart1.Annotations.Add(annotation)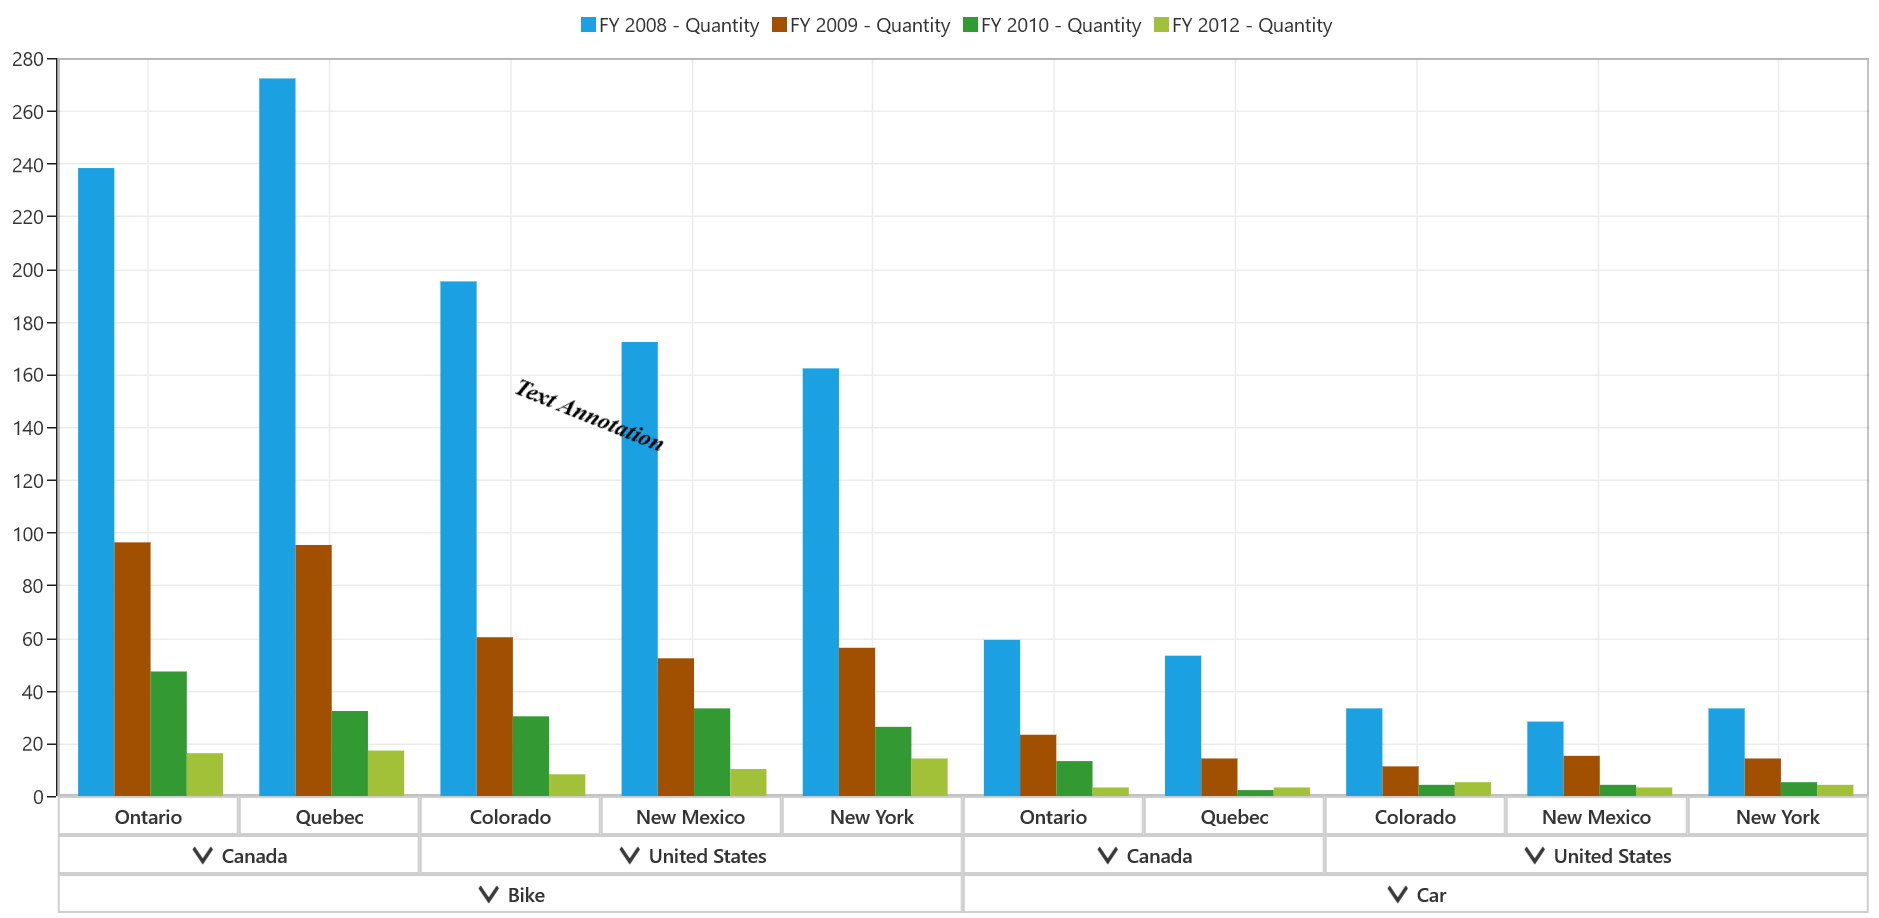
Editing text annotation
The text annotation added in the chart area type can be edited by enabling the EnableEditing property. The following code snippet demonstrates editing of the text annotation.
<syncfusion:SfPivotChart.Annotations>
<syncfusion:PivotChartAnnotation AnnotationType="TextAnnotation" Text="Text Annotation" X1="2" Y1="150" EnableEditing="True" FontFamily="Times New Roman" FontSize="16" FontWeight="Bold" FontStretch="ExtraExpanded" FontStyle="Italic"/>
</syncfusion:SfPivotChart.Annotations>
var annotation = new PivotChartAnnotation();
annotation.AnnotationType = PivotChartAnnotationType.TextAnnotation;
annotation.Text = "Text Annotation";
annotation.X1 = 2;
annotation.Y1 = 150;
annotation.FontFamily = new FontFamily("Times New Roman");
annotation.FontSize = 16;
annotation.FontWeight = FontWeights.Bold;
annotation.FontStretch = FontStretch.ExtraExpanded;
annotation.FontStyle = FontStyle.Italic;
annotation.EnableEditing = true;
PivotChart1.Annotations.Add(annotation);Dim annotation = New PivotChartAnnotation()
annotation.AnnotationType = PivotChartAnnotationType.TextAnnotation
annotation.Text = "Text Annotation"
annotation.X1 = 2
annotation.Y1 = 150
annotation.FontFamily = New FontFamily("Times New Roman")
annotation.FontSize = 16
annotation.FontWeight = FontWeights.Bold
annotation.FontStretch = FontStretch.ExtraExpanded
annotation.FontStyle = FontStyle.Italic
annotation.EnableEditing = True
PivotChart1.Annotations.Add(annotation)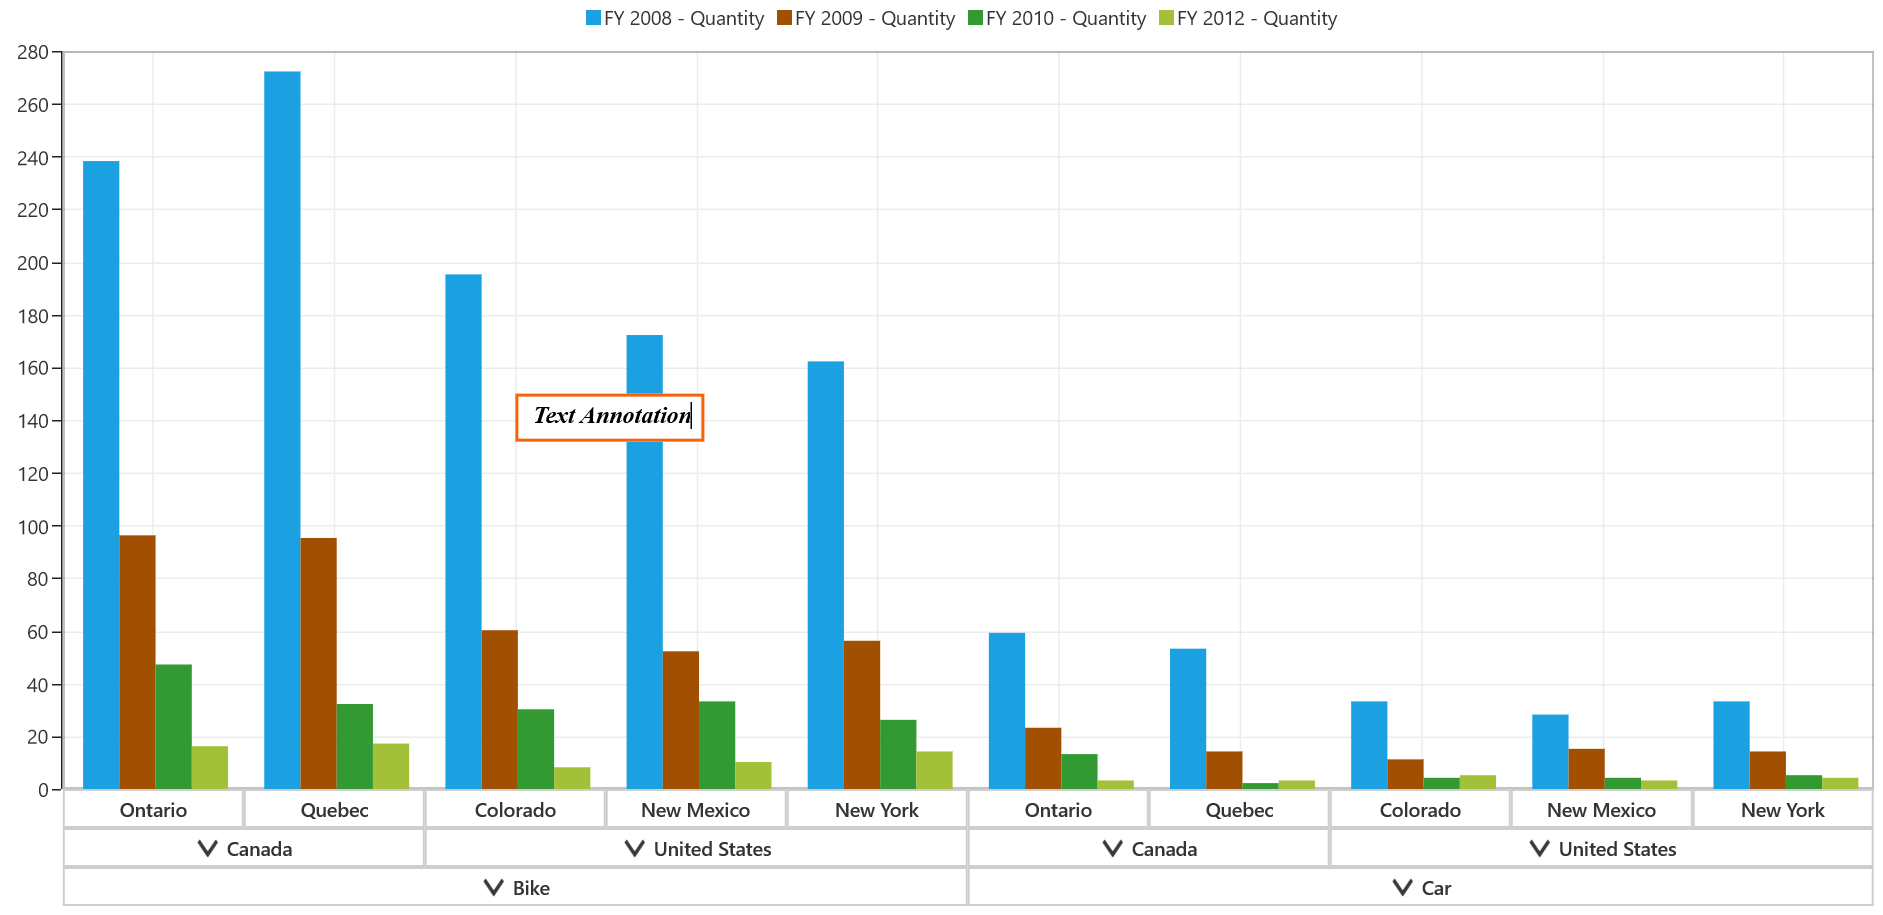
Image annotation
The SfPivotChart allows you to add an image annotation to the specific chart by mentioning the AnnotationType as ImageAnnotation. The following code snippet shows how to add the image annotation to the SfPivotChart.
<syncfusion:SfPivotChart.Annotations>
    <syncfusion:PivotChartAnnotation AnnotationType="ImageAnnotation" ImageSource="ms-appx:///Assets/anchor.jpg" X1="1" X2="1.5" Y1="50" Y2="100"/>
</syncfusion:SfPivotChart.Annotations>
var annotation = new PivotChartAnnotation();
annotation.AnnotationType = PivotChartAnnotationType.ImageAnnotation;
annotation.ImageSource = "ms-appx:///Assets/anchor.jpg";
annotation.X1 = 1;
annotation.Y1 = 50;
annotation.X2 = 1.5;
annotation.Y2 = 100;
PivotChart1.Annotations.Add(annotation);Dim annotation = New PivotChartAnnotation()
annotation.AnnotationType = PivotChartAnnotationType.ImageAnnotation
annotation.ImageSource = "ms-appx:///Assets/anchor.jpg"
annotation.X1 = 1
annotation.Y1 = 50
annotation.X2 = 1.5
annotation.Y2 = 100
PivotChart1.Annotations.Add(annotation)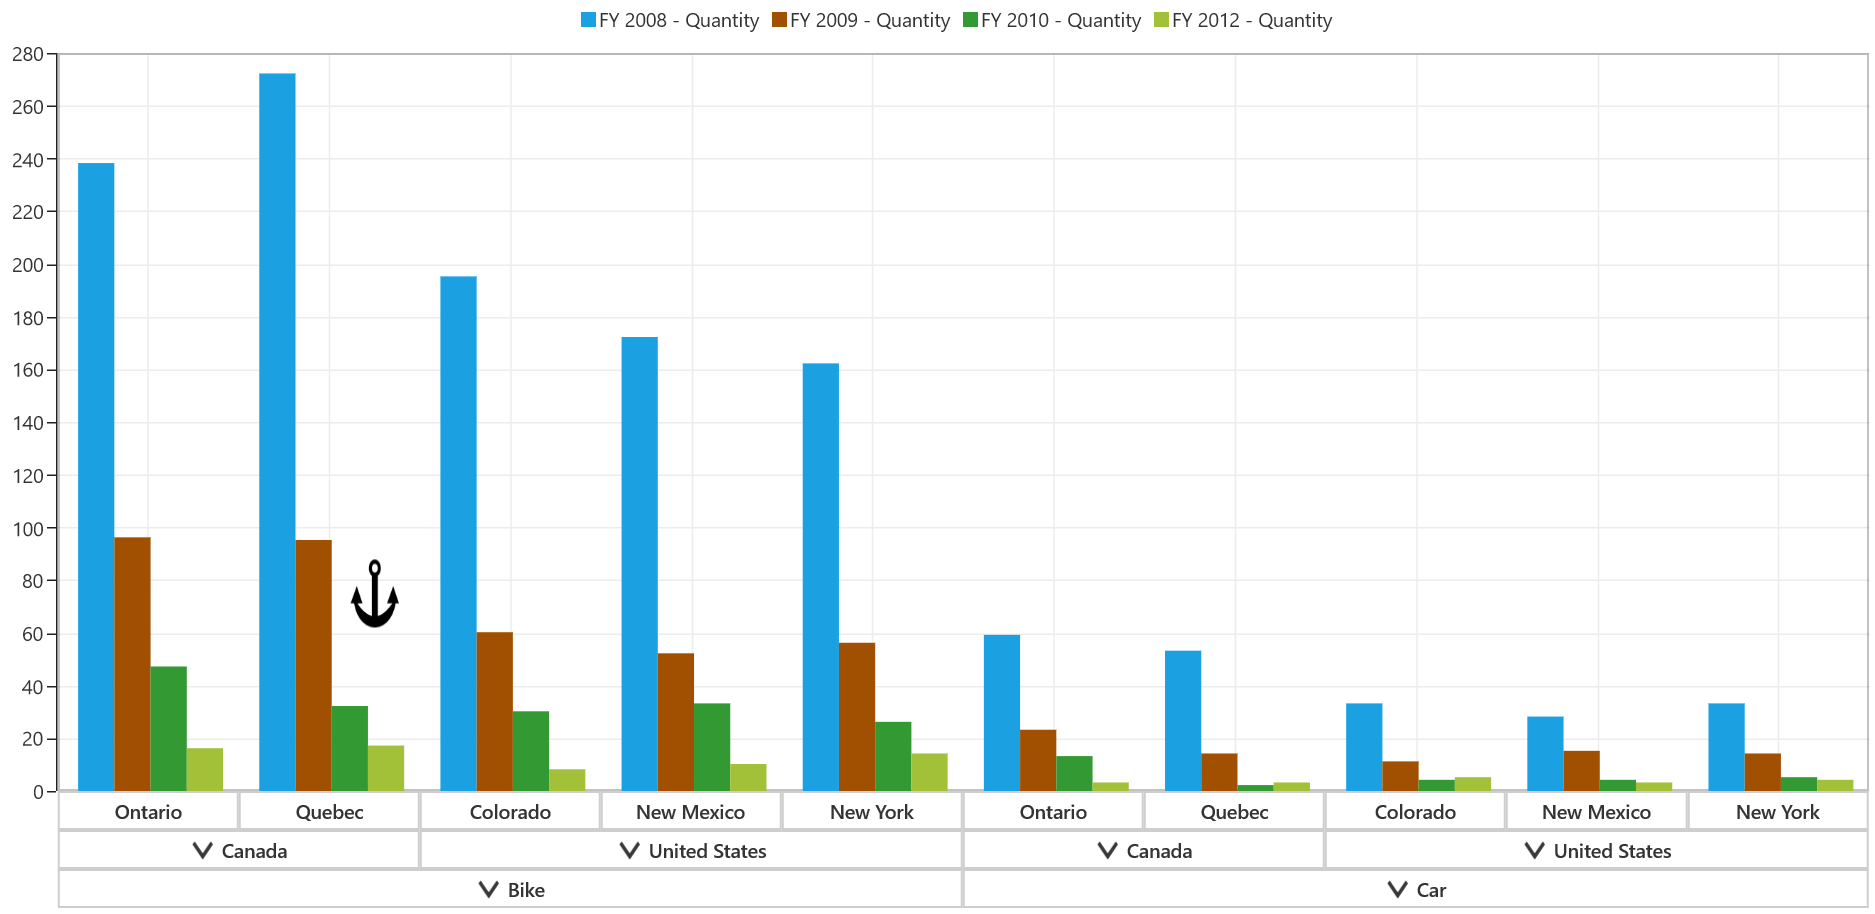
Rotating image annotation
An image annotation can be rotated by using the Angle property. The following code snippet illustrates rotating the image annotation.
<syncfusion:SfPivotChart.Annotations>
    <syncfusion:PivotChartAnnotation AnnotationType="ImageAnnotation" Angle="22" ImageSource="ms-appx:///Assets/anchor.jpg" X1="1" X2="1.5" Y1="50" Y2="100"/>
</syncfusion:SfPivotChart.Annotations>>
var annotation = new PivotChartAnnotation();
annotation.AnnotationType = PivotChartAnnotationType.ImageAnnotation;
annotation.ImageSource = "ms-appx:///Assets/anchor.jpg";
annotation.X1 = 1;
annotation.Y1 = 50;
annotation.X2 = 1.5;
annotation.Y2 = 100;
annotation.Angle = 22;
PivotChart1.Annotations.Add(annotation);Dim annotation = New PivotChartAnnotation()
annotation.AnnotationType = PivotChartAnnotationType.ImageAnnotation
annotation.ImageSource = "ms-appx:///Assets/anchor.jpg"
annotation.X1 = 1
annotation.Y1 = 50
annotation.X2 = 1.5
annotation.Y2 = 100
annotation.Angle = 22
PivotChart1.Annotations.Add(annotation)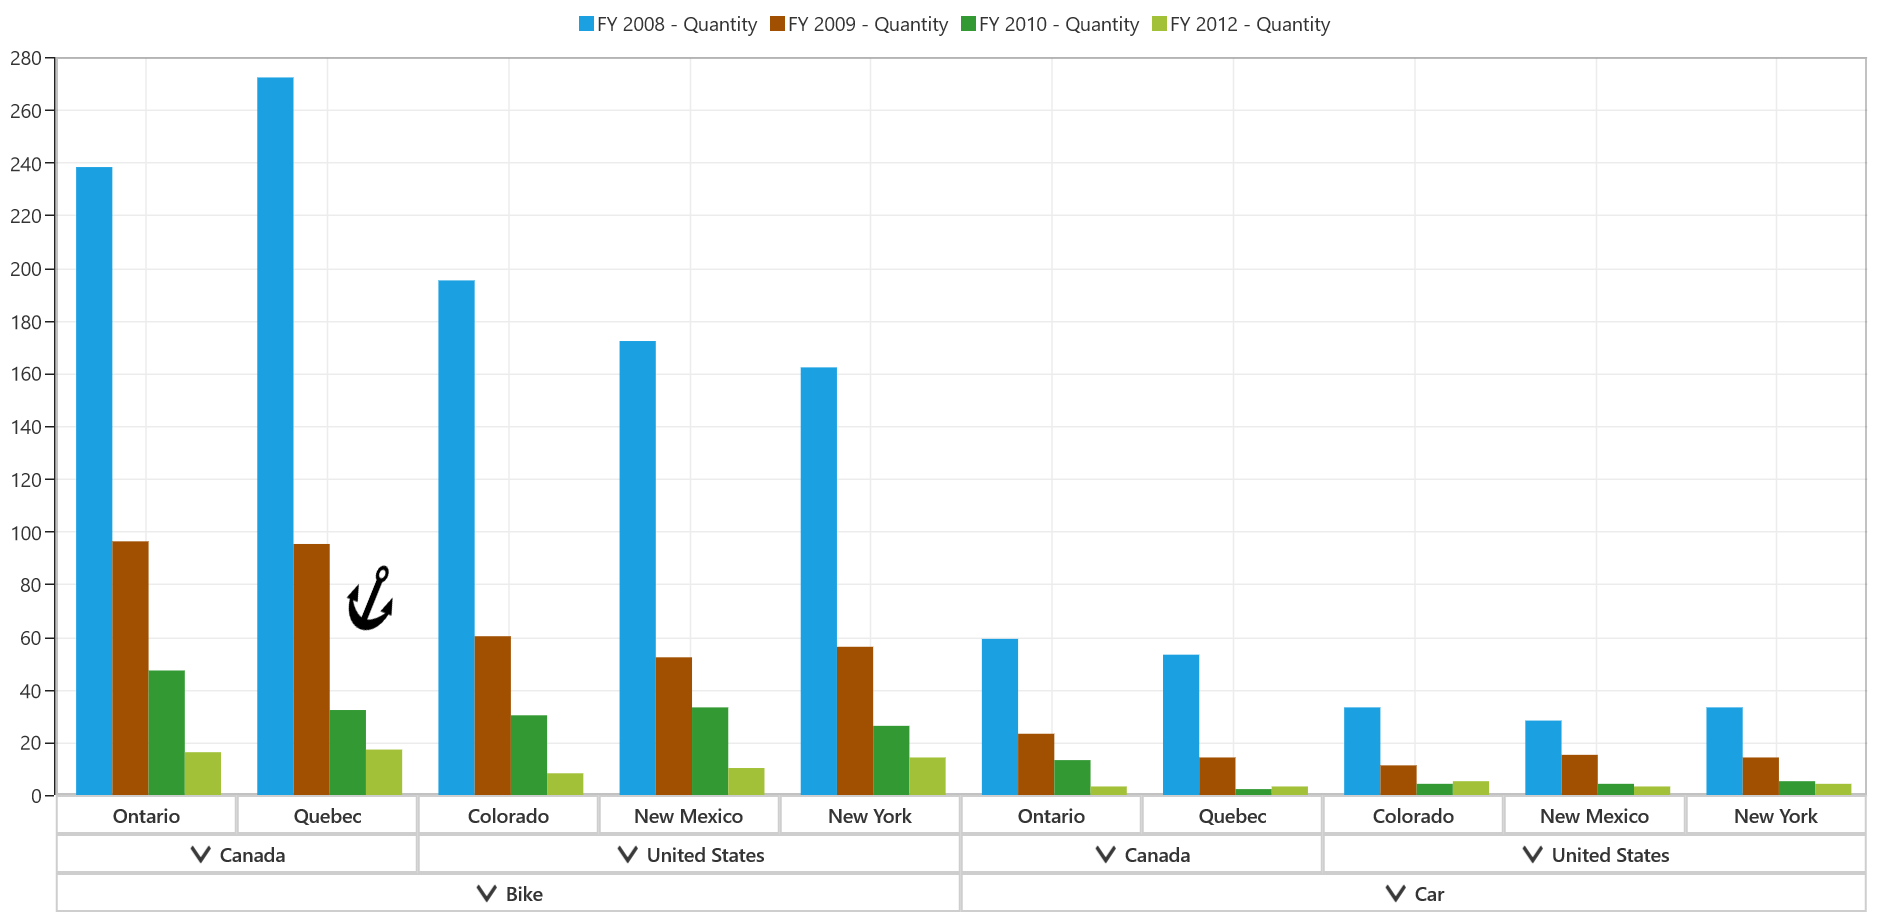
Line annotation
Line annotation draws a line over a specific chart area. The following code snippet specifies adding the line annotation to the SfPivotChart.
<syncfusion:SfPivotChart.Annotations>
<syncfusion:PivotChartAnnotation AnnotationType="LineAnnotation" LineCap="Arrow" X1="1" Y1="30" X2="2" Y2="300" Stroke="Orange" StrokeThickness="3" StrokeDashCap="Square" StrokeLineJoin="Round"/>
</syncfusion:SfPivotChart.Annotations>
var annotation = new PivotChartAnnotation();
annotation.AnnotationType = PivotChartAnnotationType.LineAnnotation;
annotation.LineCap = LineCap.Arrow;
annotation.X1 = 1;
annotation.Y1 = 30;
annotation.X2 = 2;
annotation.Y2 = 300;
annotation.Stroke = new SolidColorBrush(Colors.Orange);
annotation.StrokeThickness = 3;
annotation.StrokeDashCap = PenLineCap.Square;
annotation.StrokeLineJoin = PenLineJoin.Round;
PivotChart1.Annotations.Add(annotation);Dim annotation = New PivotChartAnnotation()
annotation.AnnotationType = PivotChartAnnotationType.LineAnnotation
annotation.LineCap = LineCap.Arrow
annotation.X1 = 1
annotation.Y1 = 30
annotation.X2 = 2
annotation.Y2 = 300
annotation.Stroke = New SolidColorBrush(Colors.Orange)
annotation.StrokeThickness = 3
annotation.StrokeDashCap = PenLineCap.Square
annotation.StrokeLineJoin = PenLineJoin.Round
PivotChart1.Annotations.Add(annotation)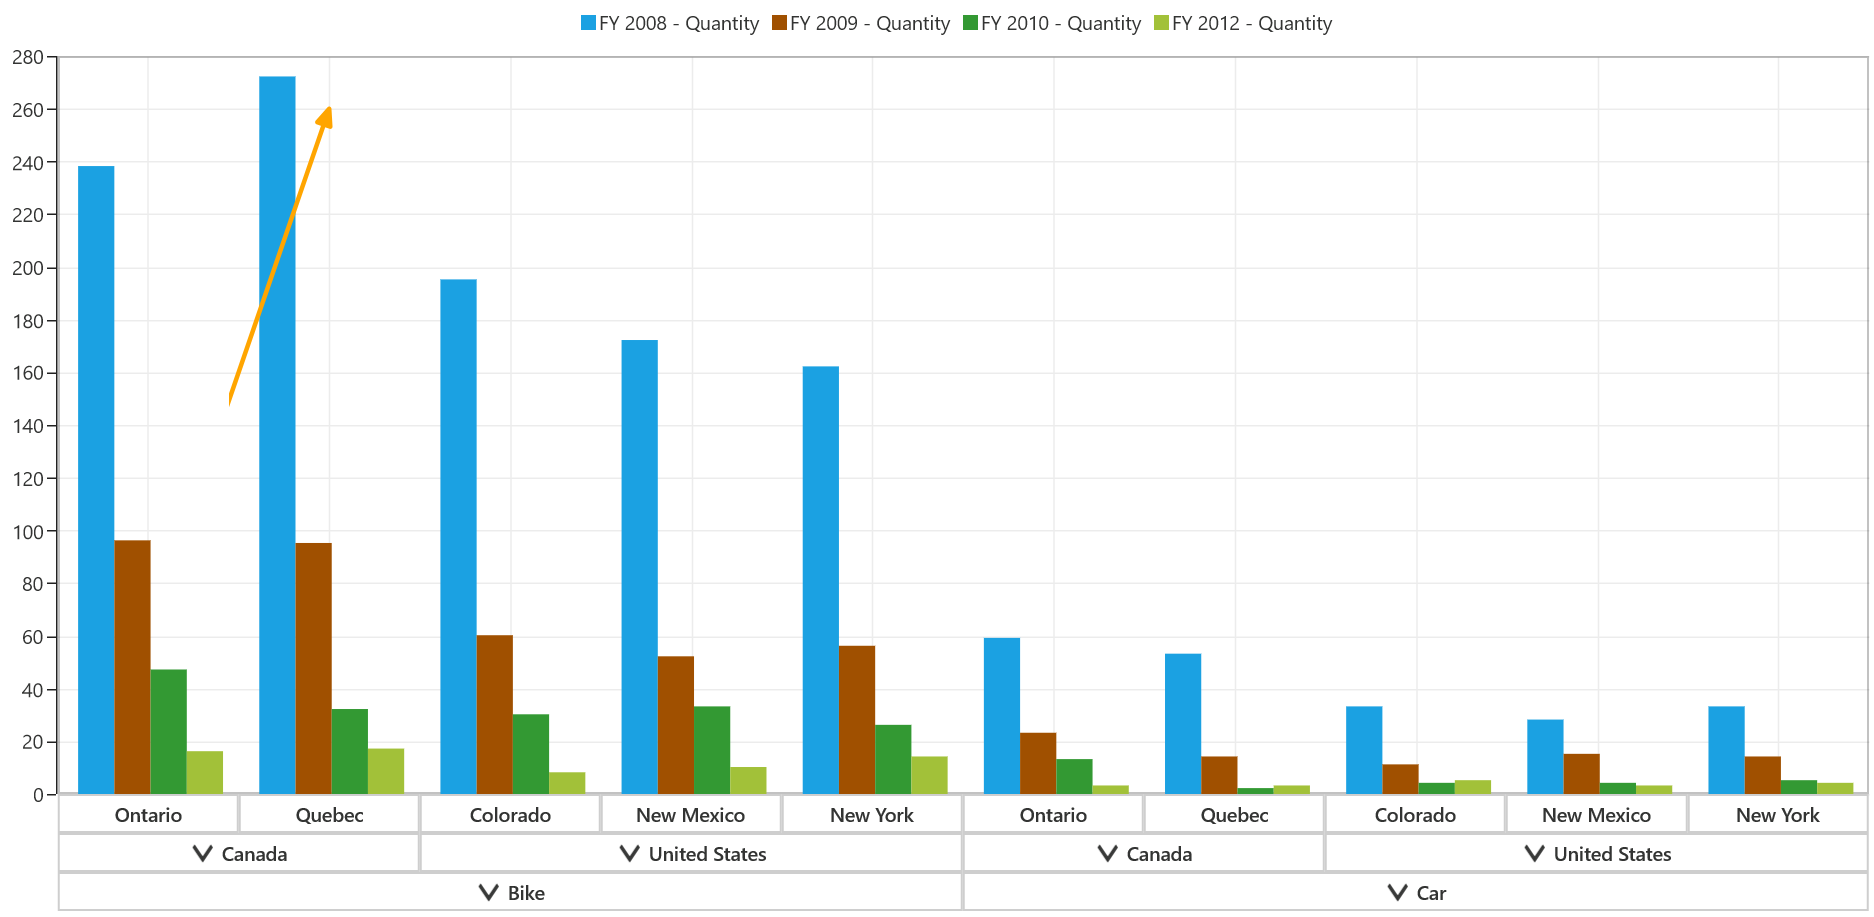
Horizontal line annotation
Horizontal line annotation draws a horizontal line over the chart area. The following code snippet demonstrates the horizontal line annotation.
<syncfusion:SfPivotChart.Annotations>
<syncfusion:PivotChartAnnotation AnnotationType="HorizontalLineAnnotation" LineCap="Arrow" X1="0" X2="2" Y1="100" Stroke="LawnGreen" StrokeThickness="3" StrokeDashCap="Square" StrokeLineJoin="Round"/>
</syncfusion:SfPivotChart.Annotations>
var annotation = new PivotChartAnnotation();
annotation.AnnotationType = PivotChartAnnotationType.HorizontalLineAnnotation;
annotation.LineCap = LineCap.Arrow;
annotation.X1 = 1;
annotation.X2 = 2;
annotation.Y1 = 100;
annotation.Stroke = new SolidColorBrush(Colors.LawnGreen);
annotation.StrokeThickness = 3;
annotation.StrokeDashCap = PenLineCap.Square;
annotation.StrokeLineJoin = PenLineJoin.Round;
PivotChart1.Annotations.Add(annotation);Dim annotation = New PivotChartAnnotation()
annotation.AnnotationType = PivotChartAnnotationType.HorizontalLineAnnotation
annotation.LineCap = LineCap.Arrow
annotation.X1 = 1
annotation.X2 = 2
annotation.Y1 = 100
annotation.Stroke = New SolidColorBrush(Colors.LawnGreen)
annotation.StrokeThickness = 3
annotation.StrokeDashCap = PenLineCap.Square
annotation.StrokeLineJoin = PenLineJoin.Round
PivotChart1.Annotations.Add(annotation)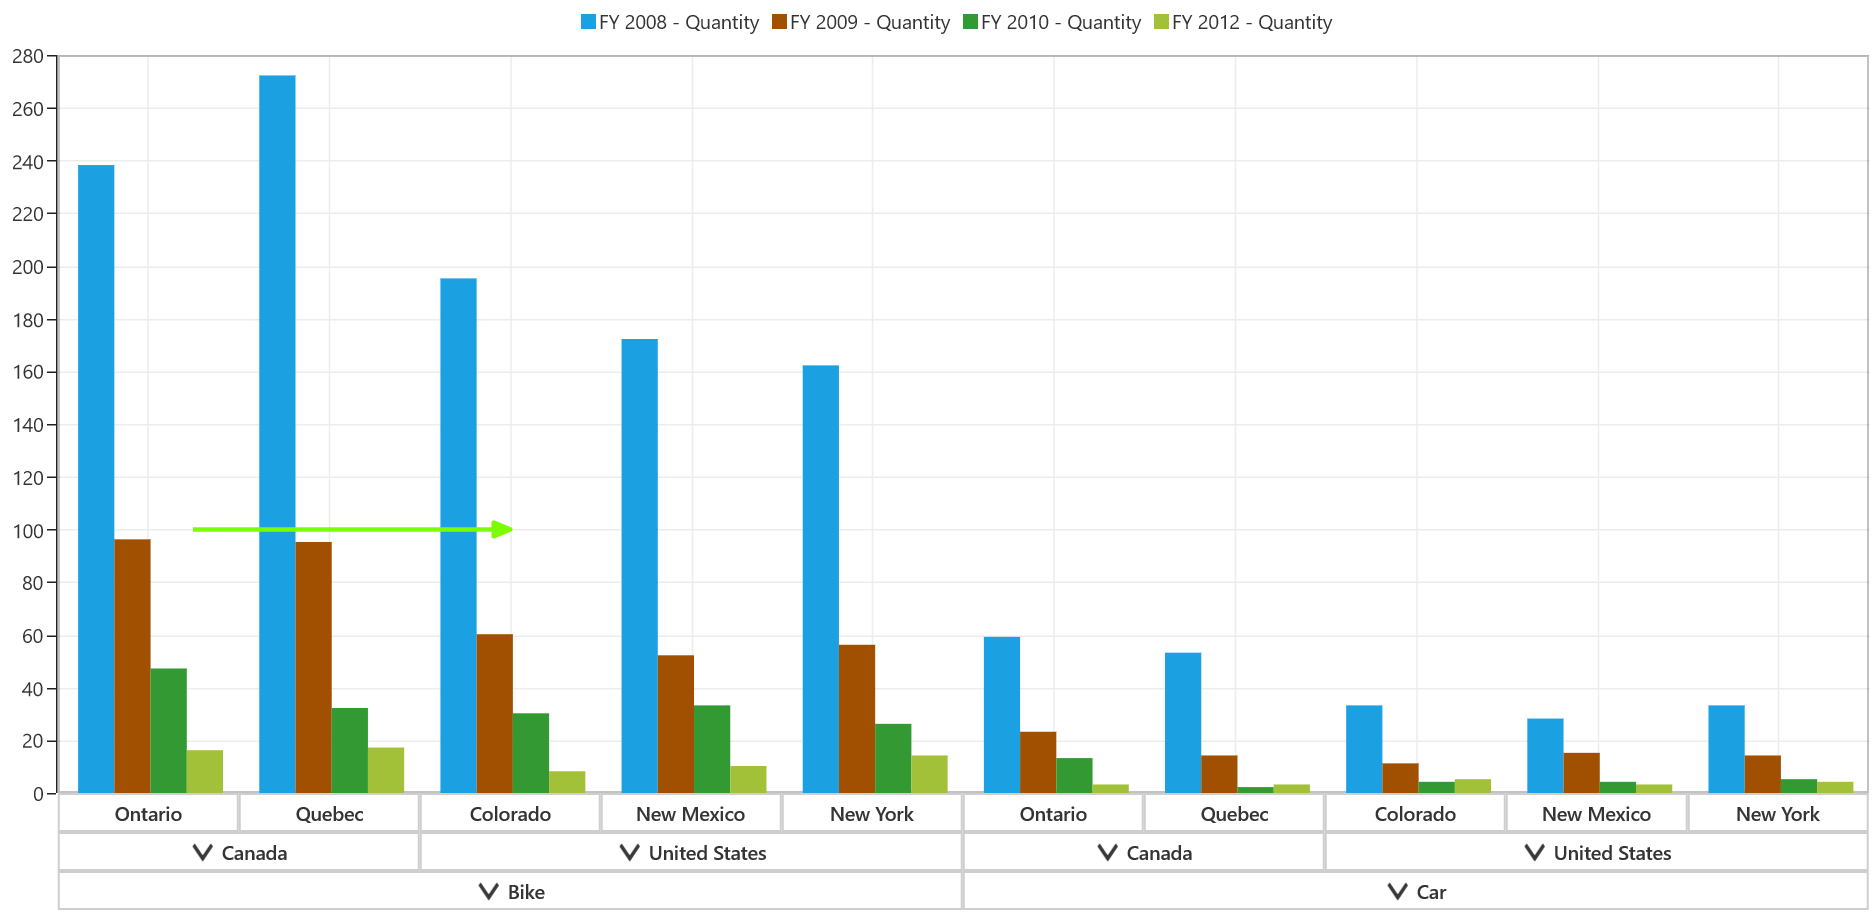
Vertical line annotation
Vertical line annotation draws a vertical line over the chart area. The following code snippet specifies the vertical line annotation.
<syncfusion:SfPivotChart.Annotations>
<syncfusion:PivotChartAnnotation AnnotationType="VerticalLineAnnotation" LineCap="Arrow" X1="1" Y1="55" Y2="300" Stroke="BrulyWood" StrokeThickness="3" StrokeDashCap="Square" StrokeLineJoin="Round"/>
</syncfusion:SfPivotChart.Annotations>
var annotation = new PivotChartAnnotation();
annotation.AnnotationType = PivotChartAnnotationType.VerticalLineAnnotation;
annotation.LineCap = LineCap.Arrow;
annotation.X1 = 1;
annotation.Y1 = 55;
annotation.Y2 = 300;
annotation.Stroke = new SolidColorBrush(Colors.Orange);
annotation.StrokeThickness = 3;
annotation.StrokeDashCap = PenLineCap.Square;
annotation.StrokeLineJoin = PenLineJoin.Round;
PivotChart1.Annotations.Add(annotation);Dim annotation = New PivotChartAnnotation()
annotation.AnnotationType = PivotChartAnnotationType.VerticalLineAnnotation
annotation.LineCap = LineCap.Arrow
annotation.X1 = 1
annotation.Y1 = 55
annotation.Y2 = 300
annotation.Stroke = New SolidColorBrush(Colors.Orange)
annotation.StrokeThickness = 3
annotation.StrokeDashCap = PenLineCap.Square
annotation.StrokeLineJoin = PenLineJoin.Round
PivotChart1.Annotations.Add(annotation)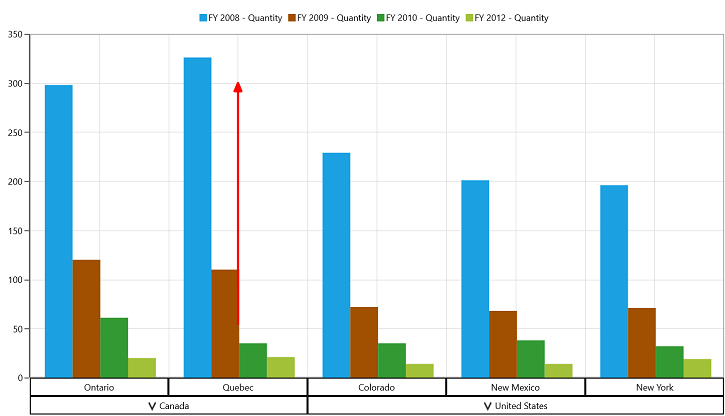
Rectangle annotation
Rectangle annotation draws a rectangle over the chart area. The following code snippet specifies how to add rectangle annotation to the chart.
<syncfusion:SfPivotChart.Annotations>
<syncfusion:PivotChartAnnotation AnnotationType="RectangleAnnotation" X1="1" X2="2" Y1="85" Y2="120" Fill="Red" Opacity="0.6"/>
</syncfusion:SfPivotChart.Annotations>
var annotation = new PivotChartAnnotation();
annotation.AnnotationType = PivotChartAnnotationType.RectangleAnnotation;
annotation.X1 = 1;
annotation.X2 = 2;
annotation.Y1 = 85;
annotation.Y2 = 120;
annotation.Fill = new SolidColorBrush(Colors.Red);
annotation.Opacity = 0.6;
PivotChart1.Annotations.Add(annotation);Dim annotation = New PivotChartAnnotation()
annotation.AnnotationType = PivotChartAnnotationType.RectangleAnnotation
annotation.X1 = 1
annotation.X2 = 2
annotation.Y1 = 85
annotation.Y2 = 120
annotation.Fill = New SolidColorBrush(Colors.Red)
annotation.Opacity = 0.6
PivotChart1.Annotations.Add(annotation)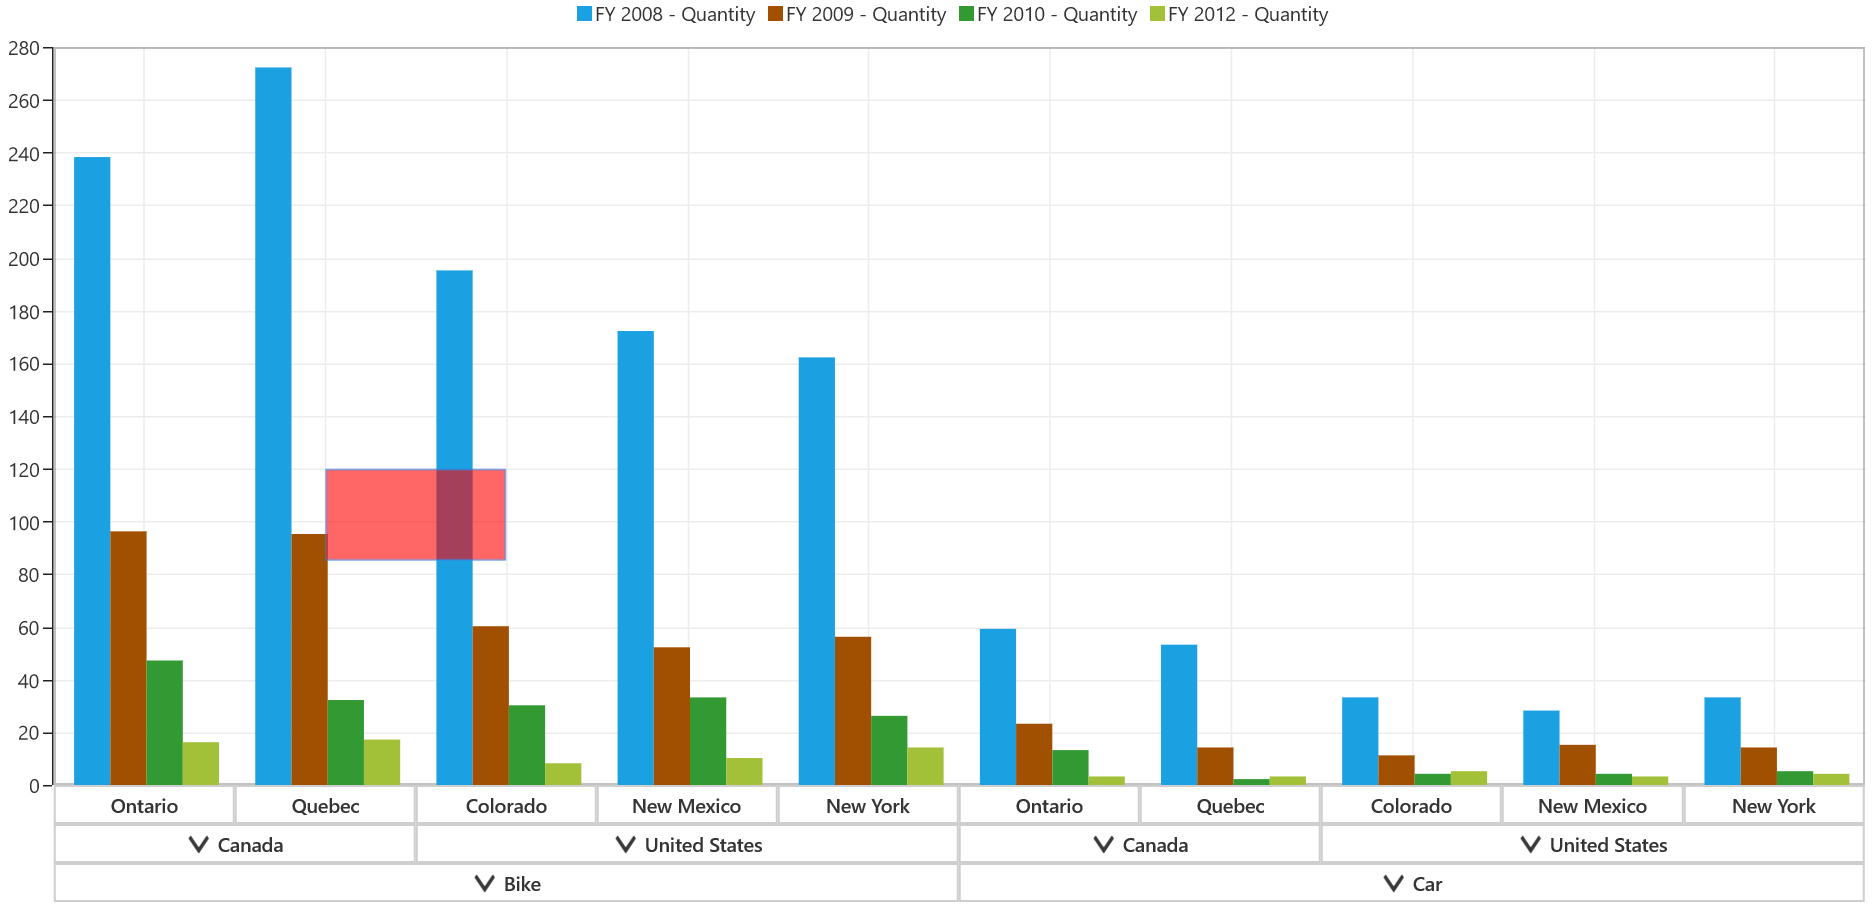
Ellipse annotation
Ellipse annotation draws an ellipse over the chart area. The following code snippet illustrates adding the ellipse annotation.
<syncfusion:SfPivotChart.Annotations>
<syncfusion:PivotChartAnnotation AnnotationType="EllipseAnnotation" X1="1" X2="2" Y1="85" Y2="120" Fill="Green" Opacity="0.6"/>
</syncfusion:SfPivotChart.Annotations>
var annotation = new PivotChartAnnotation();
annotation.AnnotationType = PivotChartAnnotationType.EllipseAnnotation;
annotation.X1 = 1;
annotation.X2 = 2;
annotation.Y1 = 85;
annotation.Y2 = 120;
annotation.Fill = new SolidColorBrush(Colors.Green);
annotation.Opacity = 0.6;
PivotChart1.Annotations.Add(annotation);Dim annotation = New PivotChartAnnotation()
annotation.AnnotationType = PivotChartAnnotationType.EllipseAnnotation
annotation.X1 = 1
annotation.X2 = 2
annotation.Y1 = 85
annotation.Y2 = 120
annotation.Fill = New SolidColorBrush(Colors.Green)
annotation.Opacity = 0.6
PivotChart1.Annotations.Add(annotation)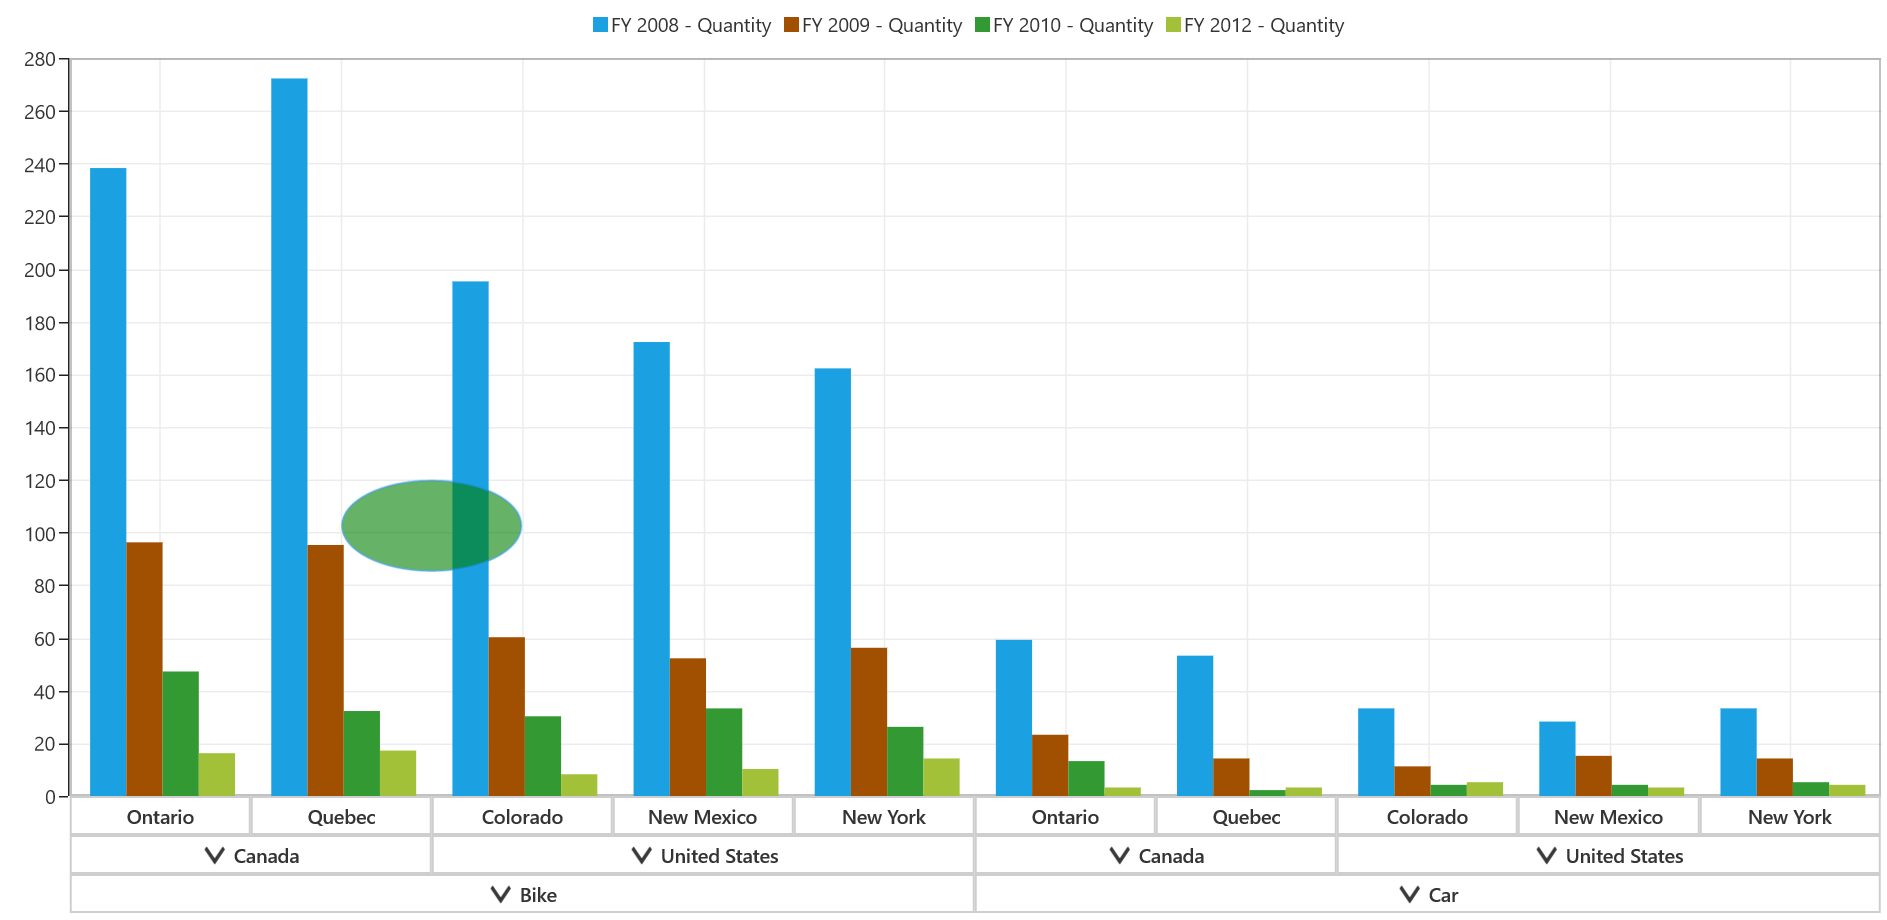
Positioning annotations
Annotations can be positioned in the SfPivotChart based on X1 and Y1 properties. For image and shape (line, ellipse, rectangle, horizontal line, and vertical line) annotations, you should specify X2 and Y2 properties. These X and Y values can be specified with axis units or pixel units and can be identified by using the CoordinateUnit property.
CoordinateUnit as axis
To position an annotation based on axis values, you should set the CoordinateUnit as axes, so that the values specified in X1 and Y1, X2 and Y2 (if needed) are considered based on the range values of primary and secondary axes.
CoordinateUnit as pixels
To position the annotation based on pixel values, you should set the CoordinateUnit as Pixels, so that the values specified in X1 and Y1, X2 and Y2 (if needed) are considered based on pixels.
Dragging and resizing annotations
The annotations can be dragged and resized by enabling the CanDrag and CanDrop properties as specified in the following code snippet.
<syncfusion:SfPivotChart.Annotations>
<syncfusion:PivotChartAnnotation AnnotationType="EllipseAnnotation" X1="1" X2="2" Y1="85" Y2="120" CanDrag="True" CanResize="True" DraggingMode="All" ResizingMode="All" Fill="Green" Opacity="0.6"/>
</syncfusion:SfPivotChart.Annotations>
var annotation = new PivotChartAnnotation();
annotation.AnnotationType = PivotChartAnnotationType.EllipseAnnotation;
annotation.X1 = 1;
annotation.X2 = 2;
annotation.Y1 = 85;
annotation.Y2 = 120;
annotation.Fill = new SolidColorBrush(Colors.Green);
annotation.Opacity = 0.6;
annotation.CanDrag = true;
annotation.CanResize = true;
annotation.DraggingMode = AxisMode.All;
annotation.ResizingMode = AxisMode.All;
PivotChart1.Annotations.Add(annotation);Dim annotation = New PivotChartAnnotation()
annotation.AnnotationType = PivotChartAnnotationType.EllipseAnnotation
annotation.X1 = 1
annotation.X2 = 2
annotation.Y1 = 85
annotation.Y2 = 120
annotation.Fill = New SolidColorBrush(Colors.Green)
annotation.Opacity = 0.6
annotation.CanDrag = True
annotation.CanResize = True
annotation.DraggingMode = AxisMode.All
annotation.ResizingMode = AxisMode.All
PivotChart1.Annotations.Add(annotation)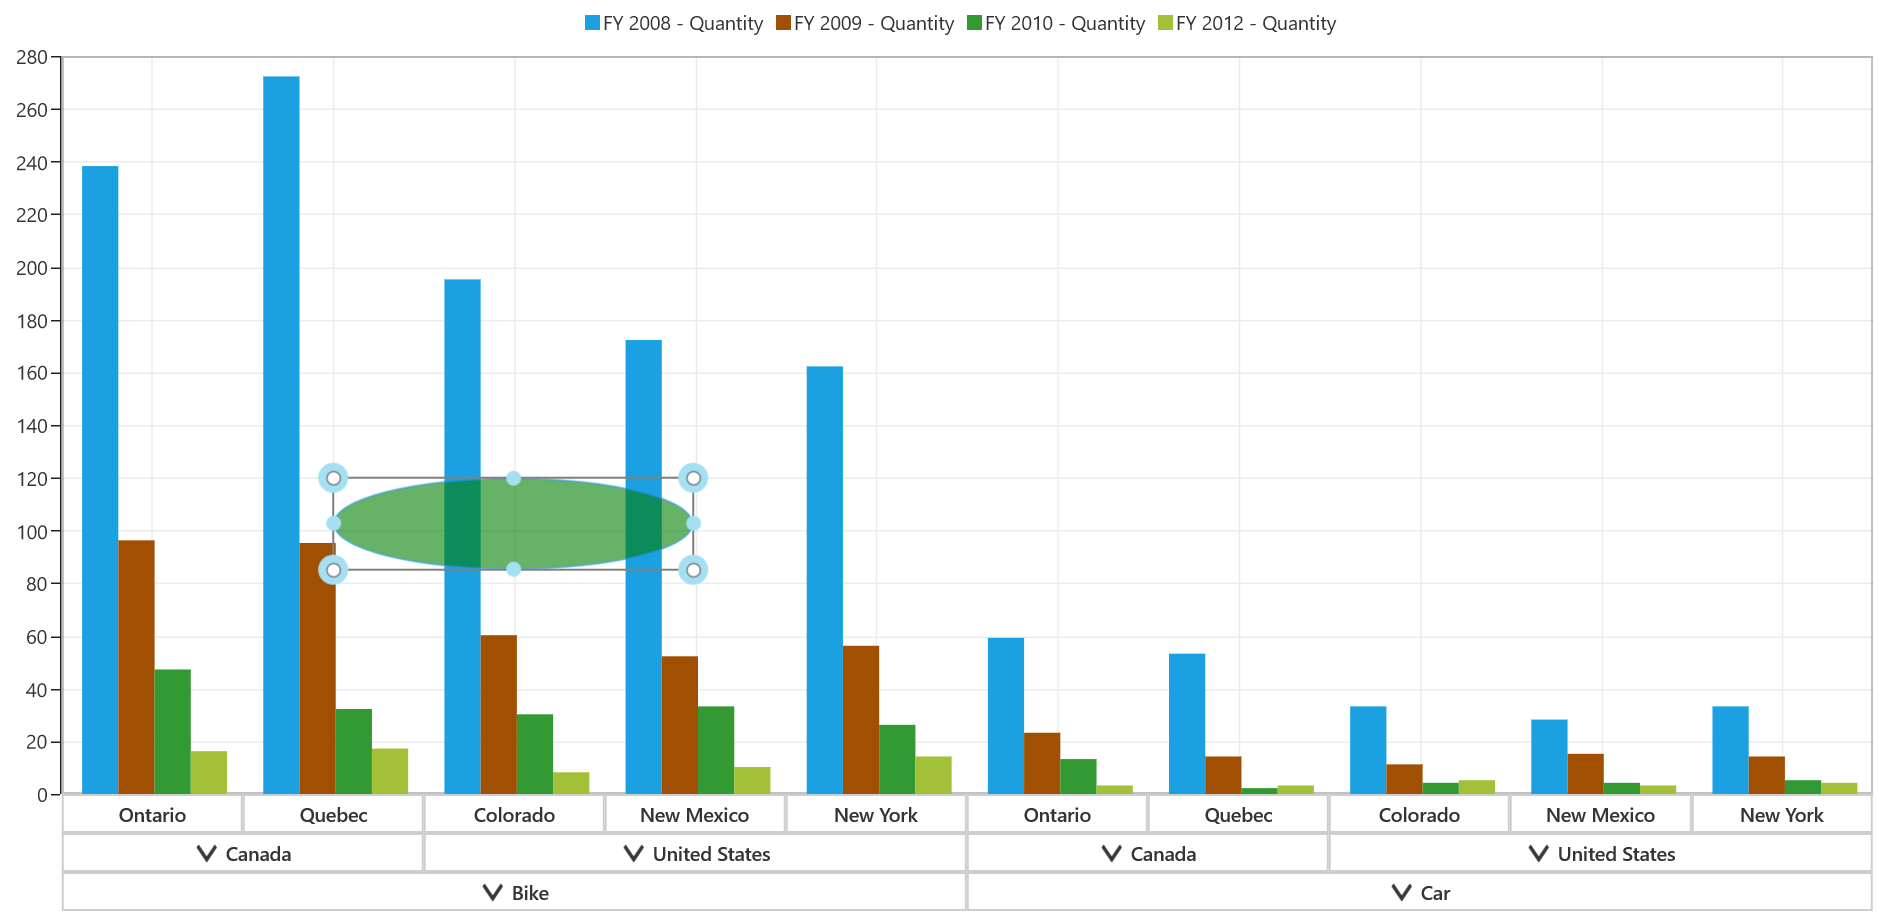
A demo sample is located in the following location.
{system drive}:\Users\<User Name>\AppData\Local\Syncfusion\EssentialStudio\<Version Number>\Samples\UWP\SampleBrowser\PivotChart\PivotChart\View\Annotations.xaml