Contents
- Local Data
- Remote Data
Having trouble getting help?
Contact Support
Contact Support
Working with Data
18 Sep 20236 minutes to read
Local Data
There are two ways to provide local data to chart.
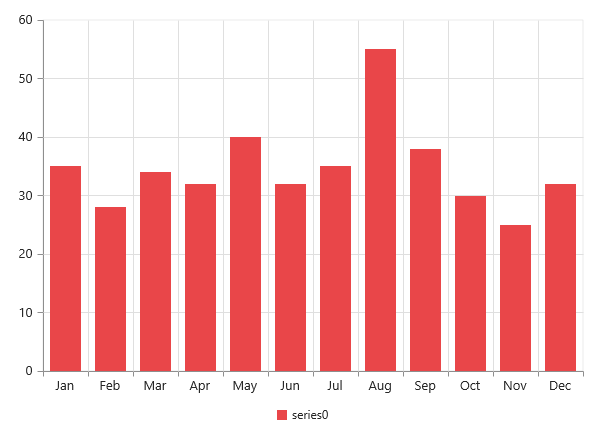
- You can bind the data to the chart by using the
dataSourceproperty of the series and then you need to map the X and Y value with thexNameandyNameproperties respectively.
NOTE
For the OHLC type series, you have to map four dataSource fields (
high,low,openandclose) to bind the data source and for the bubble series you have to map thesizefield along with thexNameandyName.
/// <reference path="tsfiles/jquery.d.ts" />
/// <reference path="tsfiles/ej.web.all.d.ts" />
     var chartData = [
          { month: 'Jan', sales: 35 }, { month: 'Feb', sales: 28 },  { month: 'Mar', sales: 34 },
          { month: 'Apr', sales: 32 },{ month: 'May', sales: 40 },{ month: 'Jun', sales: 32 },
          { month: 'Jul', sales: 35 },  { month: 'Aug', sales: 55 }, { month: 'Sep', sales: 38 },
          { month: 'Oct', sales: 30 }, { month: 'Nov', sales: 25 }, { month: 'Dec', sales: 32 }];

      $(function () {
        var chartsample = new ej.datavisualization.Chart($("#Chart"), {

          series: [{
                // ...
         	//Add datasource and set xName and yName
                dataSource: chartData,
                xName: "month",
                yName: "sales"
             }]

             // ...
        });
   });
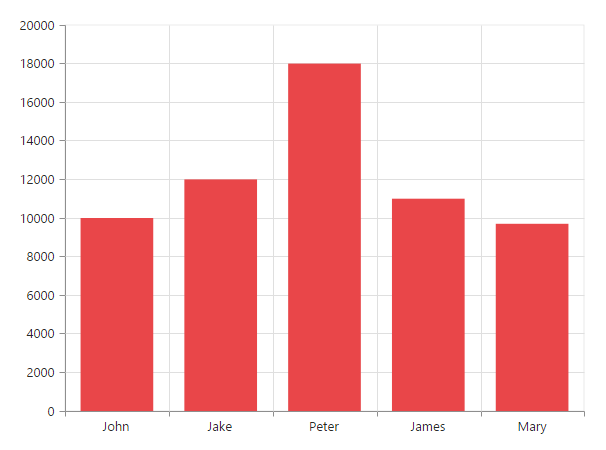
2.You can also plot data to chart using points option in the series. Using this property you can customize each and every point in the data.
$(function () {
        var chartsample = new ej.datavisualization.Chart($("#Chart"), {
           // ...

           //Initializing Series
           series: [{
               //Adding data points using x and y field of points
               points: [{ x: "John", y: 10000 }, { x: "Jake", y: 12000 }, { x: "Peter", y: 18000 },
                        { x: "James", y: 11000 }, { x: "Mary", y: 9700 }],
               // ...
           }],
            // ...

      });
   });
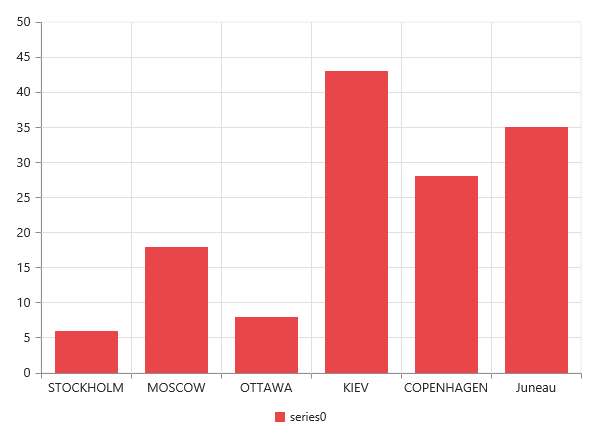
Remote Data
You can bind the remote data to the chart by using the DataManager and you can use the query property of the series to filter the data from the dataSource.
//Remote URL
        var dataManger = new ej.DataManager({
            url: "http://mvc.syncfusion.com/Services/Northwnd.svc/"
        });
        // Query creation
        var query = ej.Query().from("Orders").take(6);
      $(function () {
        var chartsample = new ej.datavisualization.Chart($("#Chart"), {
            series: [{
                type: 'column',
                dataSource: dataManger,
                xName: "ShipCity",
                yName: "Freight",
                query: query,
            }],
        });
      });