Multiple panes
18 Sep 202312 minutes to read
Chart area can be divided into multiple panes using the rowDefinitions and columnDefinitions properties.
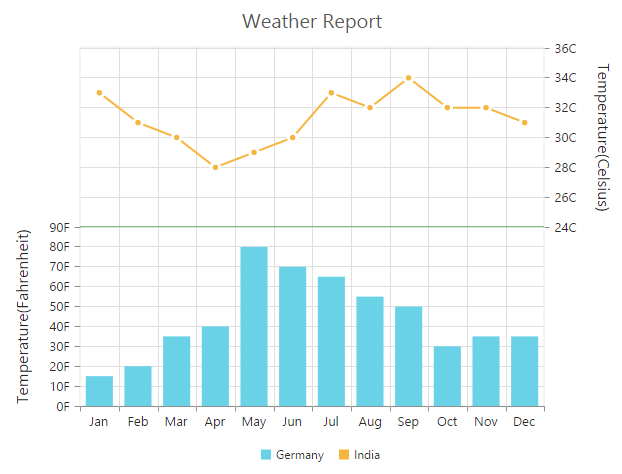
Row Definitions
To split the chart area vertically into a number of rows, use rowDefinitions of the chart.
-
You can allocate space for each row by using the
unitoption that determines whether the chart area should be split by percentage or pixels for the givenrowHeightvalue of the rowDefinitions. -
To associate a vertical axis to a row, specify the rowDefinitions index value to the
rowIndexproperty of the chart axis. -
To customize each row’s horizontal line, use
lineColorandlineWidthproperty.
/// <reference path="tsfiles/jquery.d.ts" />
/// <reference path="tsfiles/ej.web.all.d.ts" />

module ChartComponent {
    $(function () {
        var chartsample = new ej.datavisualization.Chart($("#chartcontainer"), {

               //  Splitting chart area into multiple rows
                rowDefinitions: [{
                    //  Split first row of the chart area
                    unit : 'percentage',
                    lineColor : 'Gray',
                    rowHeight : 50,
                    linewidth : 0
                }, {
                    //  Split second row of the chart area
                    unit : 'percentage',
                    lineColor : 'green',
                    rowHeight : 50,
                    linewidth : 0
                }],

                axes: [{
                          //Create secondary axis and bind it to second row of chart area
                           name: "yAxis1",
                           rowIndex: 1
                    }],
               series: [{

                         //Binding vertical axis name
                         yAxisName: "yAxis1",
                         // ...
                }],
            //  ...

        });
    });
}
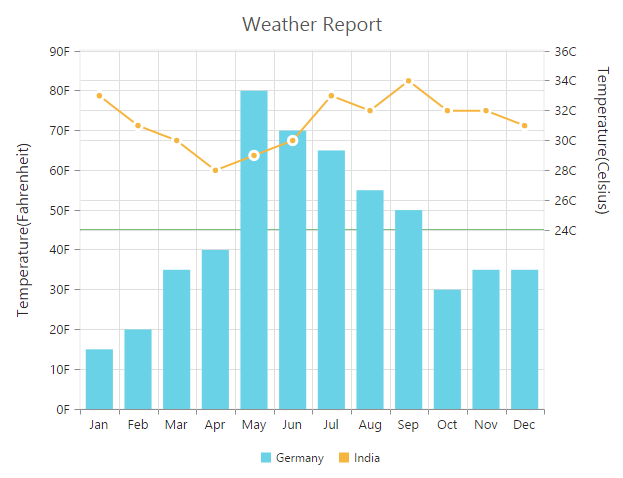
Row Span
For spanning the vertical axis along multiple panes vertically, you can use rowSpan property of axis.
var chartsample = new ej.datavisualization.Chart($("#chartcontainer"), {

            rowDefinitions: [{

                         // ...
                  },{

                         // ...
                  }],
                   axes: [{

                          // ...
                    }],

                primaryYAxis: {
                    //  Span the PrimaryYAxis
                    rowSpan : 2,
                },

               series: [{
                         // ...
                }],
            //  ...

        });
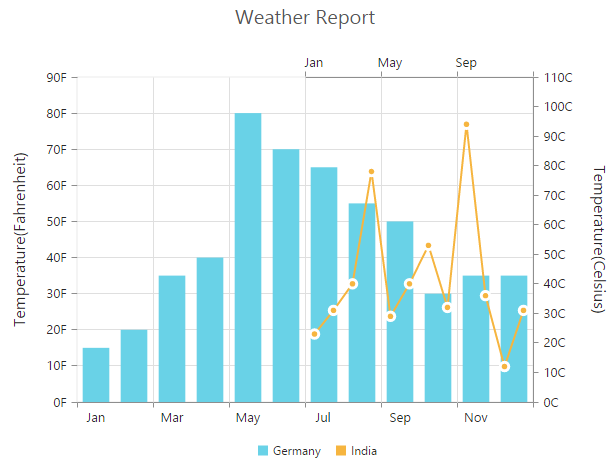
Column Definitions
To split the chart area horizontally into a number of columns, use columnDefinitions of the chart.
-
You can allocate space for each column by using the
unitoption that determines whether the chart area should be split by percentage or pixels for the givencolumnWidthvalue of the columnDefinitions. -
To associate a horizontal axis to a column, specify the columnDefinitions index value to the
columnIndexproperty of the chart axis.
var chartsample = new ej.datavisualization.Chart($("#chartcontainer"), {

               //  Splitting chart area into multiple columns
                columnDefinitions: [{
                    //  Split first column of the chart area
                    unit : 'percentage',
                    columnWidth : 50,
                }, {
                    //  Split second column of the chart area
                    unit : 'percentage',
                    columnWidth : 50,
                }],

                axes: [{
                          //Create secondary axis and bind it to second column of chart area
                           name: "xAxis1",
                           columnIndex: 1
                    }],
               series: [{

                         //Binding horizontal axis name
                         xAxisName: "xAxis1",
                         // ...
                }],
            //  ...

        });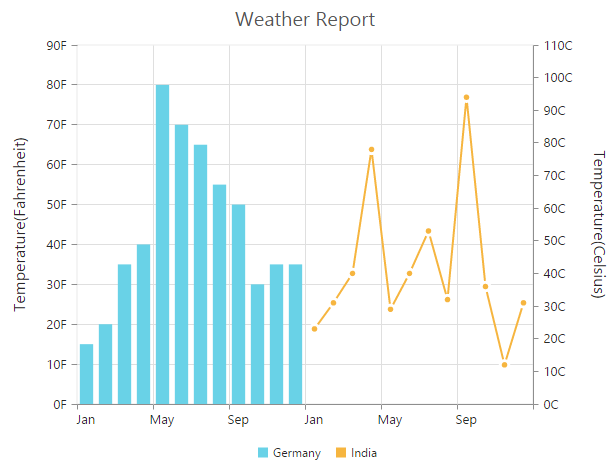
Column Span
For spanning the horizontal axis along multiple panes horizontally, you can use columnSpan property of axis.
var chartsample = new ej.datavisualization.Chart($("#chartcontainer"), {

               columnDefinitions: [{

                          // ...
                  },{

                          // ...
                  }],
                   axes: [{

                          // ...
                    }],

                primaryXAxis: {
                    //  Span the PrimaryXAxis
                    columnSpan : 2,
                },

               series: [{
                         // ...
                }],
            //  ...

        });