Doughnut Chart in .NET MAUI Circular Chart
18 Nov 20186 minutes to read
DoughnutSeries is similar to PieSeries. It is used to show the relationship between parts of data and whole data. To render a DoughnutSeries in circular chart, create an instance of the DoughnutSeries and add it to the Series collection property of SfCircularChart.
Prerequisite: Ensure that the required NuGet package is installed, the necessary namespaces are imported, and the SfCircularChart control is properly configured in your application. For detailed setup and configuration instructions, refer to the Getting Started guide.
The circular chart has Series as its default content.
<chart:SfCircularChart>
    <chart:DoughnutSeries ItemsSource="{Binding Data}"
                          XBindingPath="Product"
                          YBindingPath="SalesRate"/>
</chart:SfCircularChart>
SfCircularChart chart = new SfCircularChart();
DoughnutSeries series = new DoughnutSeries();
series.ItemsSource = (new SalesViewModel()).Data;
series.XBindingPath = "Product";
series.YBindingPath = "SalesRate";
chart.Series.Add(series);
this.Content = chart;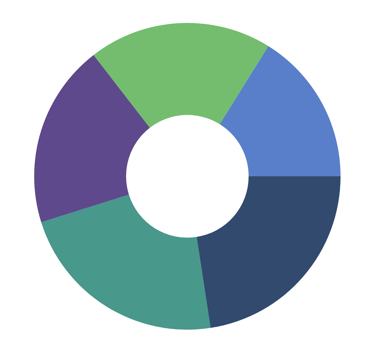
Inner Radius
The InnerRadius property of DoughnutSeries controls the size of the inner hole of the doughnut. It accepts a coefficient value from 0 to 1, where 0 renders a full pie and 1 renders an empty ring. The default value is 0.4.
<chart:SfCircularChart>
    <chart:DoughnutSeries ItemsSource="{Binding Data}"
                          XBindingPath="Product"
                          YBindingPath="SalesRate"
                          InnerRadius="0.7"/>
</chart:SfCircularChart>
SfCircularChart chart = new SfCircularChart();
DoughnutSeries series = new DoughnutSeries();
series.ItemsSource = (new SalesViewModel()).Data;
series.XBindingPath = "Product";
series.YBindingPath = "SalesRate";
series.InnerRadius = 0.7;
chart.Series.Add(series);
this.Content = chart;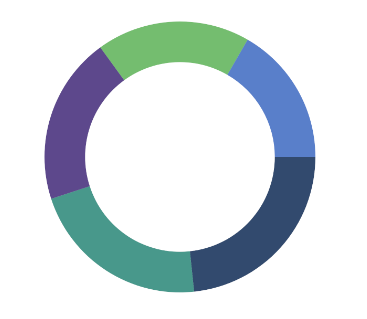
Semi Doughnut
By using the StartAngle and EndAngle properties, you can draw the doughnut series in different shapes such as a semi-doughnut or quarter-doughnut. Both properties accept values in degrees (0 to 360), where a full doughnut is drawn from StartAngle="0" to EndAngle="360".
<chart:SfCircularChart>
    <chart:DoughnutSeries ItemsSource="{Binding Data}"
                          XBindingPath="Product"
                          YBindingPath="SalesRate"
                          StartAngle="180" EndAngle="360"/>
</chart:SfCircularChart>
SfCircularChart chart = new SfCircularChart();
DoughnutSeries series = new DoughnutSeries();
series.ItemsSource = (new SalesViewModel()).Data;
series.XBindingPath = "Product";
series.YBindingPath = "SalesRate";
series.StartAngle = 180;
series.EndAngle = 360;
chart.Series.Add(series);
this.Content = chart;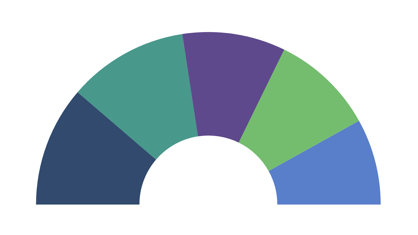
Center View
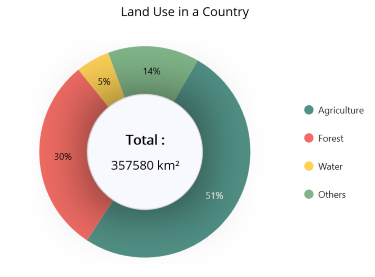
The view placed in the center of the doughnut chart is useful for sharing additional information about the doughnut chart. Any view can be added to the center of the doughnut chart using the CenterView property of DoughnutSeries. The binding context of the CenterView is the respective doughnut series, so properties such as CenterHoleSize can be bound directly against the series to size the center view container.
Center Hole Size
The CenterHoleSize property of DoughnutSeries returns the diameter of the center hole, in pixels (px). Bind the HeightRequest and WidthRequest of the CenterView container to CenterHoleSize to prevent the center view from overlapping with the doughnut segments.
<chart:SfCircularChart>
    <chart:DoughnutSeries ItemsSource="{Binding Data}" XBindingPath="Product" YBindingPath="SalesRate"/>
        <chart:DoughnutSeries.CenterView>
            <Border HeightRequest="{Binding CenterHoleSize}" WidthRequest="{Binding CenterHoleSize}">
                <Border.StrokeShape>
                    <RoundRectangle CornerRadius="200"/>
                </Border.StrokeShape>
                <VerticalStackLayout>
                    <Label Text="Total :"/>
                    <Label Text="357,580 km²"/>
                </VerticalStackLayout>
            </Border>
        </chart:DoughnutSeries.CenterView>
    </chart:DoughnutSeries>
</chart:SfCircularChart>
SfCircularChart chart = new SfCircularChart();
DoughnutSeries series = new DoughnutSeries();
series.ItemsSource = new SalesViewModel().Data;
series.XBindingPath = "Product";
series.YBindingPath = "SalesRate";
Border border = new Border();
Label name = new Label();
name.Text = "Total :";
Label value = new Label();
value.Text = "357,580 km²";
VerticalStackLayout layout = new VerticalStackLayout();
layout.Add(name);
layout.Add(value);
border.Content = layout;
series.CenterView = border;
chart.Series.Add(series);
this.Content = chart;