Class SfCircularChart
Renders two different types of circular charts, including doughnut and pie. Each chart has a different presentation of the data and is made to be more user-friendly.
Implements
Inherited Members
Namespace: Syncfusion.Maui.Charts
Assembly: Syncfusion.Maui.Charts.dll
Syntax
public class SfCircularChart : ChartBase, IContentView, IView, IElement, ITransform, IPadding, ICrossPlatformLayout, IChart, ITouchListener, ITapGestureListener, IGestureListener, IParentThemeElement, IThemeElementRemarks
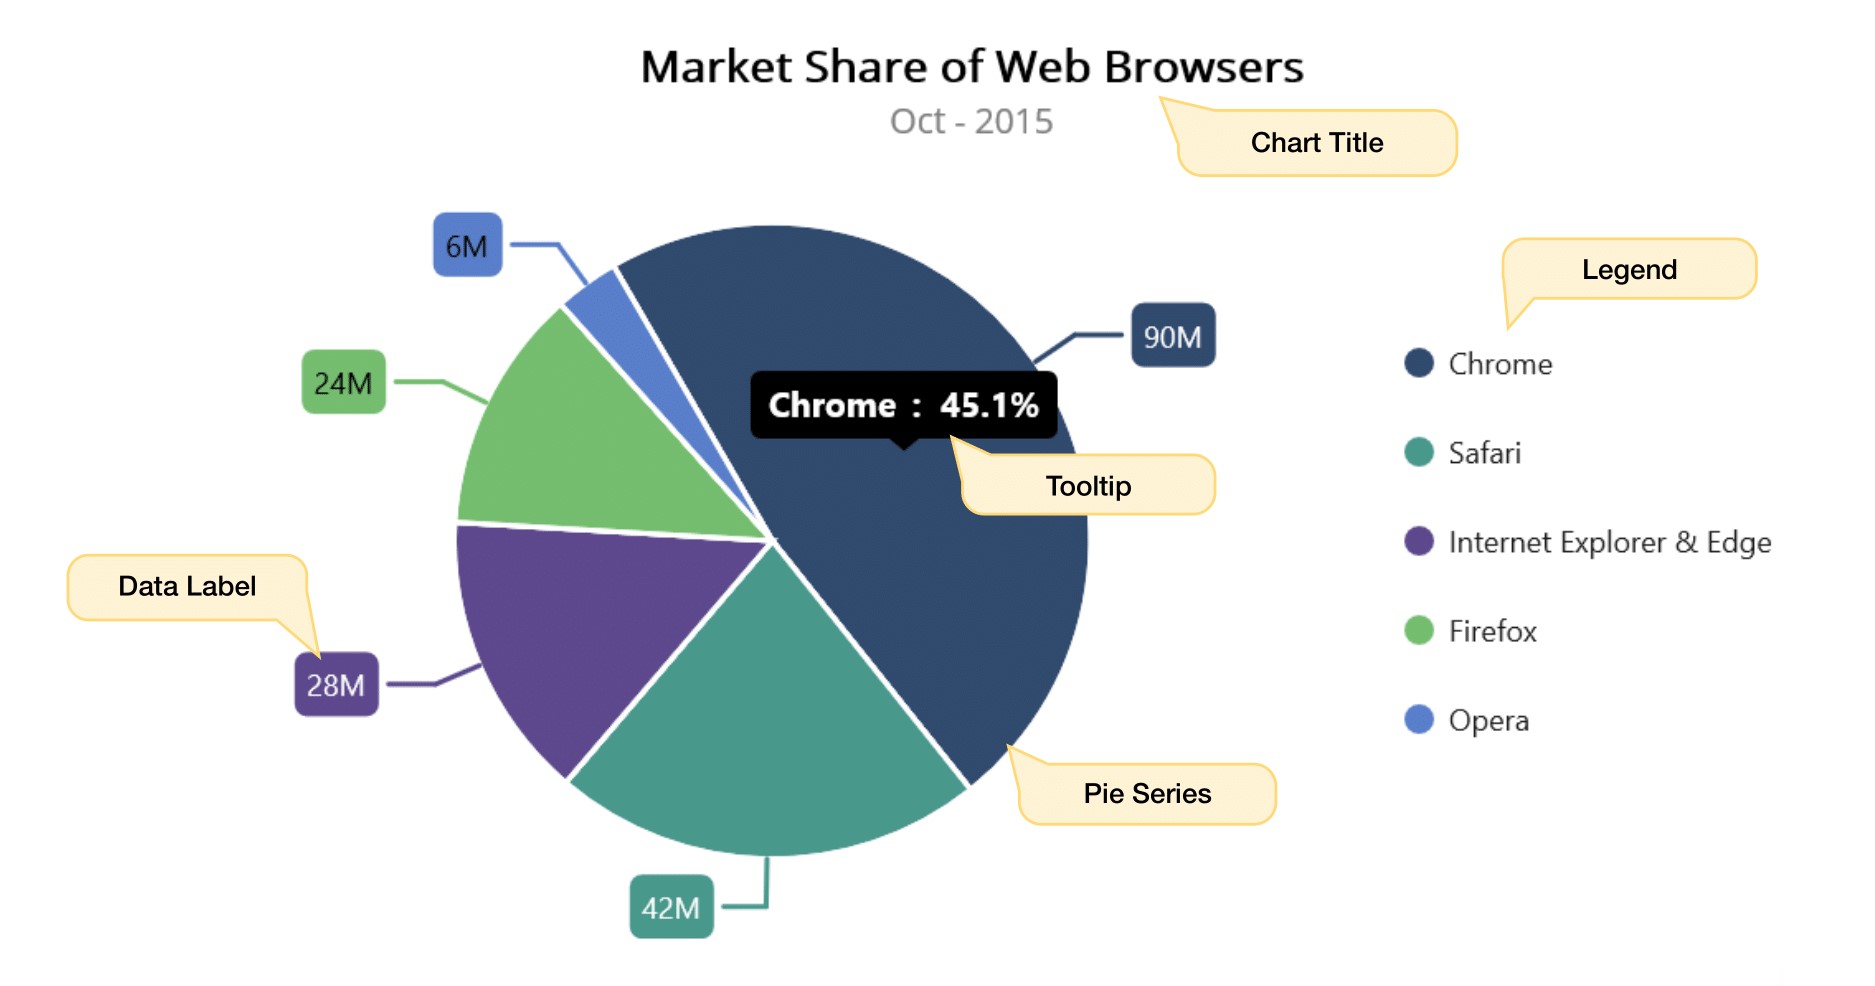
Circular chart control is used to visualize the data graphically and to display the data with proportions and percentage of different categories.
SfCircularChart class properties provides an option to add the series collection, allows to customize the chart elements such as legend, data label, and tooltip features.
Series
ChartSeries is the visual representation of data. SfCircularChart offers PieSeries and DoughnutSeries.
To render a series, create an instance of required series class, and add it to the Series collection.
<chart:SfCircularChart>

       <chart:SfCircularChart.BindingContext>
           <local:ViewModel/>
       </chart:SfCircularChart.BindingContext>

       <chart:SfCircularChart.Series>
           <chart:PieSeries ItemsSource = "{Binding Data}" XBindingPath="XValue" YBindingPath="YValue"/>
       </chart:SfCircularChart.Series>
</chart:SfCircularChart>Legend
The Legend contains list of data points in chart series. The information provided in each legend item helps to identify the corresponding data point in chart series. The Series XBindingPath property value will be displayed in the associated legend item.
To render a legend, create an instance of ChartLegend, and assign it to the Legend property.
<chart:SfCircularChart>

       <chart:SfCircularChart.BindingContext>
           <local:ViewModel/>
       </chart:SfCircularChart.BindingContext>

       <chart:SfCircularChart.Legend>
           <chart:ChartLegend/>
       </chart:SfCircularChart.Legend>

       <chart:SfCircularChart.Series>
           <chart:PieSeries ItemsSource = "{Binding Data}" XBindingPath="XValue" YBindingPath="YValue"/>
       </chart:SfCircularChart.Series>
</chart:SfCircularChart>Tooltip
Tooltip displays information while tapping or mouse hover on the segment. To display the tooltip on the chart, you need to set the EnableTooltip property as true in ChartSeries.
To customize the appearance of the tooltip elements like Background, TextColor and Font, create an instance of ChartTooltipBehavior class, modify the values, and assign it to the chart’s TooltipBehavior property.
<chart:SfCircularChart>

        <chart:SfCircularChart.BindingContext>
            <local:ViewModel/>
        </chart:SfCircularChart.BindingContext>

        <chart:SfCircularChart.TooltipBehavior>
            <chart:ChartTooltipBehavior/>
        </chart:SfCircularChart.TooltipBehavior>

        <chart:SfCircularChart.Series>
            <chart:PieSeries EnableTooltip = "True"
                             ItemsSource="{Binding Data}"
                             XBindingPath="XValue"
                             YBindingPath="YValue"/>
        </chart:SfCircularChart.Series>

</chart:SfCircularChart>Data Label
Data labels are used to display values related to a chart segment. To render the data labels, you need to enable the ShowDataLabels property as true in ChartSeries class.
To customize the chart data labels alignment, placement and label styles, need to create an instance of CircularDataLabelSettings and set to the DataLabelSettings property.
<chart:SfCircularChart>

       <chart:SfCircularChart.BindingContext>
           <local:ViewModel/>
       </chart:SfCircularChart.BindingContext>

       <chart:SfCircularChart.Series>
           <chart:DoughnutSeries ShowDataLabels = "True"
                                 ItemsSource="{Binding Data}"
                                 XBindingPath="XValue"
                                 YBindingPath="YValue"/>
       </chart:SfCircularChart.Series>
</chart:SfCircularChart>Constructors
SfCircularChart()
Initializes a new instance of the SfCircularChart class.
Declaration
public SfCircularChart()Fields
SeriesProperty
Identifies the Series bindable property.
Declaration
public static readonly BindableProperty SeriesPropertyField Value
| Type | Description |
|---|---|
| Microsoft.Maui.Controls.BindableProperty | The identifier for Series bindable property. |
Properties
Series
Gets or sets a collection of chart series to be added to the circular chart.
Declaration
public ChartSeriesCollection Series { get; set; }Property Value
| Type | Description |
|---|---|
| ChartSeriesCollection | This property takes ChartSeriesCollection instance as value. |
Remarks
To render a series, create an instance of required series class, and add it to the Series collection.
Examples
    <chart:SfCircularChart>

          <chart:SfCircularChart.BindingContext>
              <local:ViewModel/>
          </chart:SfCircularChart.BindingContext>

          <chart:SfCircularChart.Series>
              <chart:DoughnutSeries
                  ItemsSource="{Binding Data}"
                  XBindingPath="XValue"
                  YBindingPath="YValue"/>
          </chart:SfCircularChart.Series>

</chart:SfCircularChart>Methods
AnimateSeries()
Animates the visible series collection dynamically.
Declaration
public void AnimateSeries()OnBindingContextChanged()
Invoked when binding context changed.
Declaration
protected override void OnBindingContextChanged()