Pie Chart in .NET MAUI Circular Chart
18 Nov 20183 minutes to read
To render a PieSeries in a circular chart, create an instance of the PieSeries and add it to the Series collection property of SfCircularChart.
Prerequisite: Ensure that the required NuGet package is installed, the necessary namespaces are imported, and the SfCircularChart control is properly configured in your application. For detailed setup and configuration instructions, refer to the Getting Started guide.
The circular chart has Series as its default content.
<chart:SfCircularChart>
    <chart:PieSeries ItemsSource="{Binding Data}"
                     XBindingPath="Product"
                     YBindingPath="SalesRate"/>
</chart:SfCircularChart>
SfCircularChart chart = new SfCircularChart();
PieSeries series = new PieSeries();
series.ItemsSource = (new SalesViewModel()).Data;
series.XBindingPath = "Product";
series.YBindingPath = "SalesRate";
chart.Series.Add(series);
this.Content = chart;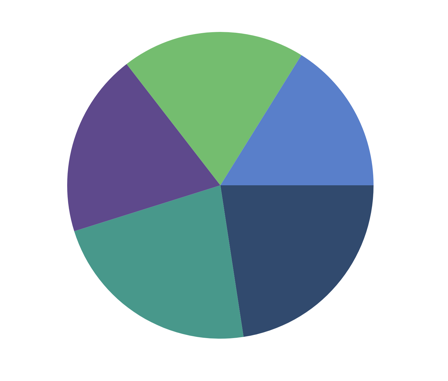
Radius
The Radius property, of type double, controls the rendering size of the PieSeries as a coefficient of the available chart area. The default value is 0.8, which makes the series fill the chart area.
<chart:SfCircularChart>
    <chart:PieSeries ItemsSource="{Binding Data}"
                     XBindingPath="Product"
                     YBindingPath="SalesRate"
                     Radius="0.9"/>
</chart:SfCircularChart>
SfCircularChart chart = new SfCircularChart();
PieSeries series = new PieSeries();
series.ItemsSource = (new SalesViewModel()).Data;
series.XBindingPath = "Product";
series.YBindingPath = "SalesRate";
series.Radius = 0.9;
chart.Series.Add(series);
this.Content = chart;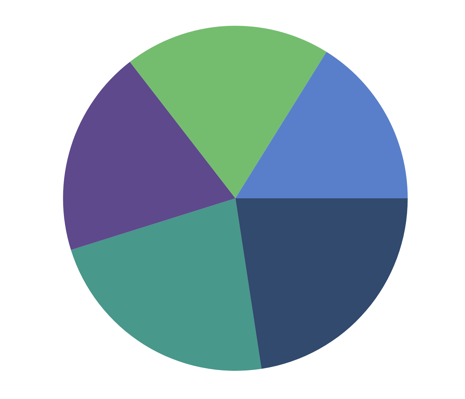
Semi pie
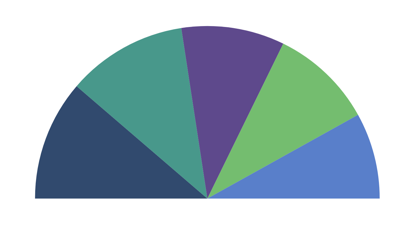
By using the StartAngle and EndAngle properties, of type double, you can draw the pie series in different shapes such as a semi pie or a quarter pie. Both properties are measured in degrees, with default values of 0 (StartAngle) and 360 (EndAngle).
<chart:SfCircularChart>
    <chart:PieSeries ItemsSource="{Binding Data}"
                     XBindingPath="Product"
                     YBindingPath="SalesRate"
                     StartAngle="180"
                     EndAngle="360"/>
</chart:SfCircularChart>
SfCircularChart chart = new SfCircularChart();
PieSeries series = new PieSeries();
series.ItemsSource = (new SalesViewModel()).Data;
series.XBindingPath = "Product";
series.YBindingPath = "SalesRate";
series.StartAngle = 180;
series.EndAngle = 360;
chart.Series.Add(series);
this.Content = chart;