Waterfall Chart in .NET MAUI Chart
Waterfall Chart
WaterfallSeries clarifies the cumulative effect of a set of provided positive and negative values. The series is represented by a rectangle and a connector between the rectangles. To render a waterfall chart, create an instance of WaterfallSeries, and add it to the Series collection property of the SfCartesianChart
- SummaryBindingPath of the string type is used to get or set the path value on the source subject to serve summary values to the series.
- SummaryPointsBrush of brush type is used to change the fill of the summary segment of the series. .
- NegativePointsBrush of brush type is used to change the fill of the negative segment of the series.
- AllowAutoSum of bool type is used to change the summary segment calculation. By default, the property is true. When disabling this property, it renders the segment by using the y value of provided ItemsSource collection.
-
ShowConnectorLine of bool type is used to enable or disable the connector line. By default, the property value is
true.
<chart:SfCartesianChart>
    <chart:SfCartesianChart.XAxes>
        <chart:CategoryAxis/>
    </chart:SfCartesianChart.XAxes>

    <chart:SfCartesianChart.YAxes>
        <chart:NumericalAxis/>
    </chart:SfCartesianChart.YAxes>

    <chart:SfCartesianChart.Series>
        <chart:WaterfallSeries ItemsSource="{Binding Sales}"
                               XBindingPath="Department"
                               YBindingPath="Value"
                               AllowAutoSum="True"
                               NegativePointsBrush="Red"
                               SummaryBindingPath="IsSummary"
                               SummaryPointsBrush="RoyalBlue"
                               ShowConnectorLine="True"/>
    </chart:SfCartesianChart.Series>
</chart:SfCartesianChart>
SfCartesianChart chart = new SfCartesianChart();
CategoryAxis xAxis = new CategoryAxis();
NumericalAxis yAxis = new NumericalAxis();
chart.XAxes.Add(xAxis);
chart.YAxes.Add(yAxis);
ViewModel viewModel = new ViewModel();
// Create a new WaterfallSeries to display the data
WaterfallSeries series = new WaterfallSeries()
{
ItemsSource = new viewModel().Sales,
XBindingPath = "Department",
YBindingPath = "Value",
AllowAutoSum = true,
NegativePointsBrush = new SolidColorBrush(Colors.Red),
SummaryBindingPath = "IsSummary",
SummaryPointsBrush = new SolidColorBrush(Colors.RoyalBlue),
ShowConnectorLine = true,
};
// Add the created series to the chart
chart.Series.Add(series);
this.Content = chart;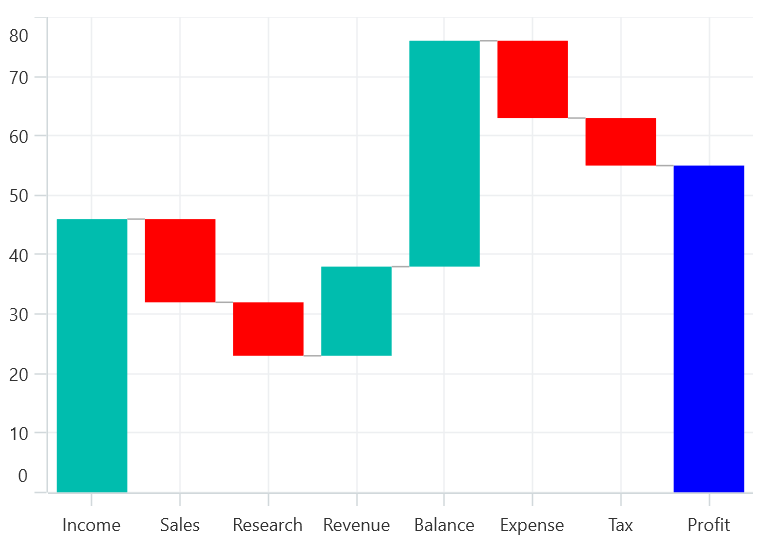
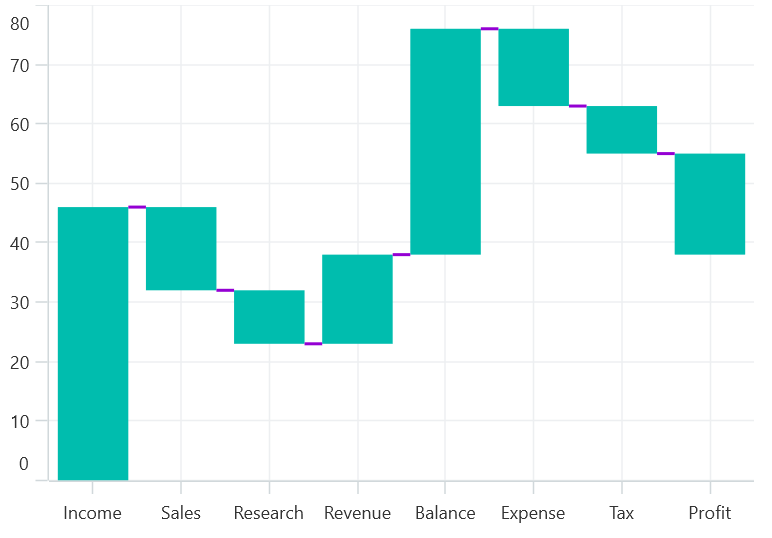
Connector line customization
The connector line can be customized by applying the ConnectorLineStyle property of the series.
The following code example illustrates how to apply style for connector line.
<chart:SfCartesianChart.Series>
    <chart:WaterfallSeries ItemsSource="{Binding Sales}"
                           XBindingPath="Department"
                           YBindingPath="Value">
        <chart:WaterfallSeries.ConnectorLineStyle>
                <chart:ChartLineStyle Stroke="DarkViolet" StrokeWidth="2"/>
        </chart:WaterfallSeries.ConnectorLineStyle>
    </chart:WaterfallSeries>
</chart:SfCartesianChart.Series>
// Define the style for the connector lines in the waterfall chart.
ChartLineStyle lineStyle = new ChartLineStyle()
{
Stroke = new SolidColorBrush(Colors.DarkViolet),
StrokeThickness = 2
};
WaterfallSeries series = new WaterfallSeries()
{
ItemsSource = new viewModel().Sales,
XBindingPath = "Department",
YBindingPath = "Value",
ConnectorLineStyle = lineStyle, // Apply the previously defined line style to the connector lines in the series.
};