How can I help you?
Stacked Line Chart in .NET MAUI Chart
Stacked Line Chart
The stacked line chart is a type of chart that displays multiple line series stacked on top of each other, with the values of each series combined to show a cumulative value of the data points.
To render a stacked line chart, create an instance of the StackingLineSeries and add it to the Series collection property of the SfCartesianChart.
NOTE
The Cartesian chart has a Series as its default content.
<chart:SfCartesianChart>
    ...
    <chart:SfCartesianChart.XAxes>
        <chart:CategoryAxis/>
    </chart:SfCartesianChart.XAxes>

    <chart:SfCartesianChart.YAxes>
        <chart:NumericalAxis/>
    </chart:SfCartesianChart.YAxes>

    <chart:StackingLineSeries ItemsSource="{Binding Data1}"
                              XBindingPath="Month"
                              YBindingPath="Value"/>

    <chart:StackingLineSeries ItemsSource="{Binding Data2}"
                              XBindingPath="Month"
                              YBindingPath="Value"/>

    <chart:StackingLineSeries ItemsSource="{Binding Data3}"
                              XBindingPath="Month"
                              YBindingPath="Value"/>

    <chart:StackingLineSeries ItemsSource="{Binding Data4}"
                              XBindingPath="Month"
                              YBindingPath="Value"/>
</chart:SfCartesianChart>
SfCartesianChart chart = new SfCartesianChart();
CategoryAxis primaryAxis = new CategoryAxis();
chart.XAxes.Add(primaryAxis);
NumericalAxis secondaryAxis = new NumericalAxis();
chart.YAxes.Add(secondaryAxis);
ViewModel viewModel = new ViewModel();
// Create a StackingLineSeries for the chart
StackingLineSeries series1 = new StackingLineSeries()
{
ItemsSource = viewModel.Data1,
XBindingPath = "Month",
YBindingPath = "Value",
};
StackingLineSeries series2 = new StackingLineSeries()
{
ItemsSource = viewModel.Data2,
XBindingPath = "Month",
YBindingPath = "Value",
};
StackingLineSeries series3 = new StackingLineSeries()
{
ItemsSource = viewModel.Data3,
XBindingPath = "Month",
YBindingPath = "Value",
};
StackingLineSeries series4 = new StackingLineSeries()
{
ItemsSource = viewModel.Data4,
XBindingPath = "Month",
YBindingPath = "Value",
};
// Add each series to the chart's Series collection
chart.Series.Add(series1);
chart.Series.Add(series2);
chart.Series.Add(series3);
chart.Series.Add(series4);
this.Content = chart;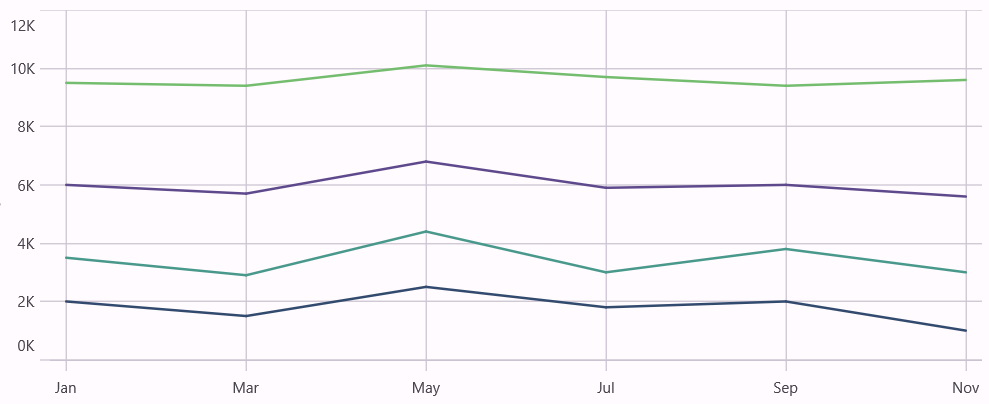
Dashed Stacked Line
The StrokeDashArray property of StackingLineSeries is used to render the stacked line series with dashes. Odd value is considered as rendering size and even value is considered as gap.
<chart:SfCartesianChart>
    <chart:SfCartesianChart.Resources>
        <DoubleCollection x:Key="dashArray">
            <x:Double>5</x:Double>
            <x:Double>2</x:Double>
        </DoubleCollection>
    </chart:SfCartesianChart.Resources>

    <chart:SfCartesianChart.XAxes>
        <chart:CategoryAxis/>
    </chart:SfCartesianChart.XAxes>

    <chart:SfCartesianChart.YAxes>
        <chart:NumericalAxis/>
    </chart:SfCartesianChart.YAxes>

    <chart:StackingLineSeries ItemsSource="{Binding Data1}"
                              XBindingPath="Month"
                              YBindingPath="Value"
                              StrokeDashArray="{StaticResource dashArray}"/>

    <chart:StackingLineSeries ItemsSource="{Binding Data2}"
                              XBindingPath="Month"
                              YBindingPath="Value"
                              StrokeDashArray="{StaticResource dashArray}"/>

    <chart:StackingLineSeries ItemsSource="{Binding Data3}"
                              XBindingPath="Month"
                              YBindingPath="Value"
                              StrokeDashArray="{StaticResource dashArray}"/>

    <chart:StackingLineSeries ItemsSource="{Binding Data4}"
                              XBindingPath="Month"
                              YBindingPath="Value"
                              StrokeDashArray="{StaticResource dashArray}"/>
</chart:SfCartesianChart>
SfCartesianChart chart = new SfCartesianChart();
CategoryAxis primaryAxis = new CategoryAxis();
chart.XAxes.Add(primaryAxis);
NumericalAxis secondaryAxis = new NumericalAxis();
chart.YAxes.Add(secondaryAxis);
ViewModel viewModel = new ViewModel();
// Create a DoubleCollection to define the stroke dash patterns for the lines
DoubleCollection doubleCollection = new DoubleCollection();
doubleCollection.Add(5);
doubleCollection.Add(2);
. . .
StackingLineSeries series1 = new StackingLineSeries()
{
ItemsSource = viewModel.Data1,
XBindingPath = "Month",
YBindingPath = "Value",
StrokeDashArray = doubleCollection // Define dashed line style
};
StackingLineSeries series2 = new StackingLineSeries()
{
ItemsSource = viewModel.Data2,
XBindingPath = "Month",
YBindingPath = "Value",
StrokeDashArray = doubleCollection // Define dashed line style
};
StackingLineSeries series3 = new StackingLineSeries()
{
ItemsSource = viewModel.Data3,
XBindingPath = "Month",
YBindingPath = "Value",
StrokeDashArray = doubleCollection // Define dashed line style
};
StackingLineSeries series4 = new StackingLineSeries()
{
ItemsSource = viewModel.Data4,
XBindingPath = "Month",
YBindingPath = "Value",
StrokeDashArray = doubleCollection // Define dashed line style
};
chart.Series.Add(series1);
chart.Series.Add(series2);
chart.Series.Add(series3);
chart.Series.Add(series4);
this.Content = chart;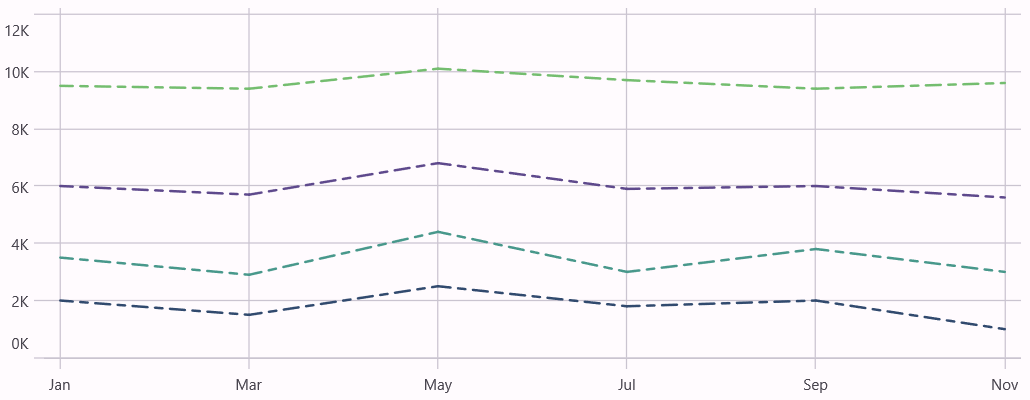
Enable Marker
A marker, also known as a symbol, is used to determine or highlight the position of the data point. To enable markers in the series, set the ShowMarkers property to true.
<chart:SfCartesianChart>
 . . .
    <chart:StackingLineSeries ItemsSource="{Binding Data1}"
                              XBindingPath="Month"
                              YBindingPath="Value"
                              ShowMarkers="True"/>

    <chart:StackingLineSeries ItemsSource="{Binding Data2}"
                              XBindingPath="Month"
                              YBindingPath="Value"
                              ShowMarkers="True"/>

    <chart:StackingLineSeries ItemsSource="{Binding Data3}"
                              XBindingPath="Month"
                              YBindingPath="Value"
                              ShowMarkers="True"/>

    <chart:StackingLineSeries ItemsSource="{Binding Data4}"
                              XBindingPath="Month"
                              YBindingPath="Value"
                              ShowMarkers="True"/>
</chart:SfCartesianChart>
SfCartesianChart chart = new SfCartesianChart();
ViewModel viewModel = new ViewModel();
. . .
StackingLineSeries series1 = new StackingLineSeries()
{
ItemsSource = viewModel.Data1,
XBindingPath = "Month",
YBindingPath = "Value",
ShowMarkers = true, // Display markers on data points
};
StackingLineSeries series2 = new StackingLineSeries()
{
ItemsSource = viewModel.Data2,
XBindingPath = "Month",
YBindingPath = "Value",
ShowMarkers = true, // Display markers on data points
};
StackingLineSeries series3 = new StackingLineSeries()
{
ItemsSource = viewModel.Data3,
XBindingPath = "Month",
YBindingPath = "Value",
ShowMarkers = true, // Display markers on data points
};
StackingLineSeries series4 = new StackingLineSeries()
{
ItemsSource = viewModel.Data4,
XBindingPath = "Month",
YBindingPath = "Value",
ShowMarkers = true, // Display markers on data points
};
chart.Series.Add(series1);
chart.Series.Add(series2);
chart.Series.Add(series3);
chart.Series.Add(series4);
this.Content = chart;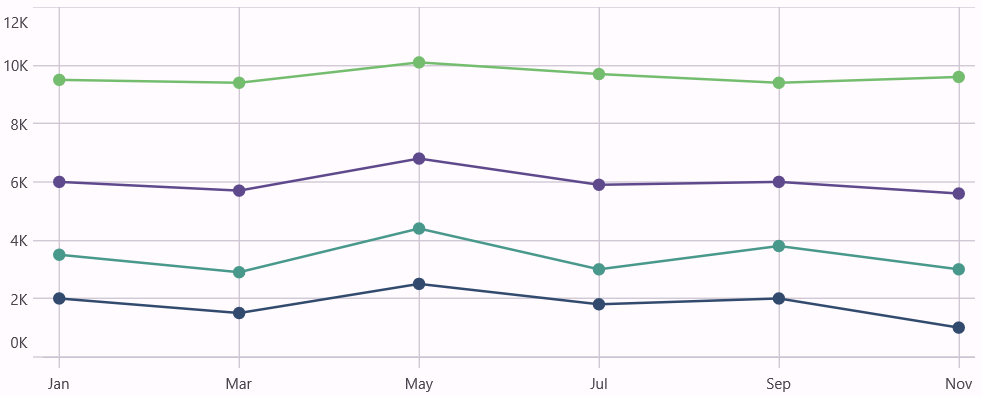
Marker customization
In order to change the series markers appearance, create an instance of the MarkerSettings property. The following properties are used to customize marker appearance.
-
Type, of type
ShapeType, describes the shape of the series marker. The default value of this property is ShapeType.Circle. -
Stroke, of type
Brush, indicates the brush used to paint the marker border. -
StrokeWidth, of type
double, indicates the width of the marker border. -
Fill, of type
Brush, indicates the color of the marker. -
Width, of type
double, indicates the width of the marker. -
Height, of type
double, indicates the height of the marker.
<chart:SfCartesianChart>
    ...
    <chart:StackingLineSeries ItemsSource="{Binding Data1}"
                              XBindingPath="Month"
                              YBindingPath="Value"
                              ShowMarkers="True">
        <chart:StackingLineSeries.MarkerSettings>
            <chart:ChartMarkerSettings Type="Diamond"
                                       StrokeWidth="2"
                                       Fill="White"
                                       Height="8"
                                       Width="8"/>
        </chart:StackingLineSeries.MarkerSettings>
    </chart:StackingLineSeries>
</chart:SfCartesianChart>
SfCartesianChart chart = new SfCartesianChart();
ViewModel viewModel = new ViewModel();
...
// Define settings for the chart markers
ChartMarkerSettings chartMarker= new ChartMarkerSettings()
{
Type = ShapeType.Diamond,
Fill = Colors.White,
StrokeWidth = 2,
Height = 8,
Width = 8,
};
StackingLineSeries series = new StackingLineSeries()
{
ItemsSource = viewModel.Data,
XBindingPath = "Month",
YBindingPath = "Value",
ShowMarkers = true,
MarkerSettings = chartMarker, // Apply the defined marker settings
};
chart.Series.Add(series);
this.Content = chart;