Stacked Area Chart in .NET MAUI Chart
Stacked Area Chart
The stacked area chart enables users to visually represent data points on top of each other to indicate the cumulative value of the data points.
To render a stacked area chart, create an instance of the StackingAreaSeries and add it to the Series collection property of the SfCartesianChart.
NOTE
The Cartesian chart has a Series as its default content.
<chart:SfCartesianChart>
    ...
    <chart:SfCartesianChart.XAxes>
        <chart:CategoryAxis/>
    </chart:SfCartesianChart.XAxes>

    <chart:SfCartesianChart.YAxes>
        <chart:NumericalAxis/>
    </chart:SfCartesianChart.YAxes>

    <chart:StackingAreaSeries ItemsSource="{Binding Data1}"
                              XBindingPath="Year"
                              YBindingPath="Value"/>

    <chart:StackingAreaSeries ItemsSource="{Binding Data2}"
                              XBindingPath="Year"
                              YBindingPath="Value"/>

    <chart:StackingAreaSeries ItemsSource="{Binding Data3}"
                              XBindingPath="Year"
                              YBindingPath="Value"/>

    <chart:StackingAreaSeries ItemsSource="{Binding Data4}"
                              XBindingPath="Year"
                              YBindingPath="Value"/>
</chart:SfCartesianChart>
SfCartesianChart chart = new SfCartesianChart();
CategoryAxis primaryAxis = new CategoryAxis();
chart.XAxes.Add(primaryAxis);
NumericalAxis secondaryAxis = new NumericalAxis();
chart.YAxes.Add(secondaryAxis);
ViewModel viewModel = new ViewModel();
// Create a StackingAreaSeries for the chart
StackingAreaSeries series1 = new StackingAreaSeries()
{
ItemsSource = viewModel.Data1
XBindingPath = "Year",
YBindingPath = "Value",
};
StackingAreaSeries series2 = new StackingAreaSeries()
{
ItemsSource = viewModel.Data2
XBindingPath = "Year",
YBindingPath = "Value",
};
StackingAreaSeries series3 = new StackingAreaSeries()
{
ItemsSource = viewModel.Data3
XBindingPath = "Year",
YBindingPath = "Value",
};
StackingAreaSeries series4 = new StackingAreaSeries()
{
ItemsSource = viewModel.Data4
XBindingPath = "Year",
YBindingPath = "Value",
};
// Add all series to the chart for rendering
chart.Series.Add(series1);
chart.Series.Add(series2);
chart.Series.Add(series3);
chart.Series.Add(series4);
this.Content = chart;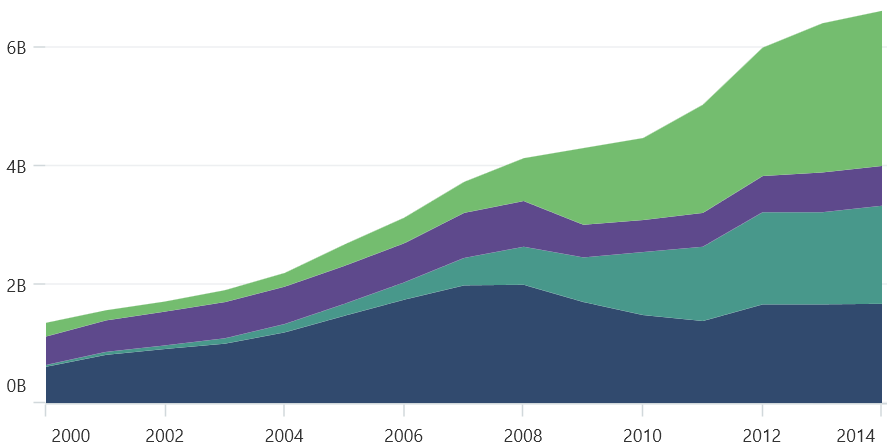
Enable Marker
A marker, also known as a symbol, is used to determine or highlight the position of the data point. To enable markers in the series, set the ShowMarkers property to true.
<chart:SfCartesianChart>
    ...
    <chart:StackingAreaSeries ItemsSource="{Binding Data}"
                              XBindingPath="Year"
                              YBindingPath="Value"
                              ShowMarkers="True"/>
</chart:SfCartesianChart>
SfCartesianChart chart = new SfCartesianChart();
...
StackingAreaSeries series = new StackingAreaSeries()
{
ItemsSource = new ViewModel().Data,
XBindingPath = "Year",
YBindingPath = "Value",
ShowMarkers = true // Enable markers on the data points in the series
};
chart.Series.Add(series);
this.Content= chart;Marker customization
In order to change the series markers appearance, create an instance of the MarkerSettings property. The following properties are used to customize marker appearance.
-
Type, of type
ShapeType, describes the shape of the series marker. The default value of this property is the ShapeType.Circle. -
Stroke, of type
Brush, indicates the brush used to paint the marker border. -
StrokeWidth, of type
double, indicates the width of the marker border. -
Fill, of type
Brush, indicates the color of the marker. -
Width, of type
double, indicates the width of the marker. -
Height, of type
double, indicates the height of the marker.
<chart:SfCartesianChart>
    ...
    <chart:StackingAreaSeries ItemsSource="{Binding Data}"
                              XBindingPath="Year"
                              YBindingPath="Value"
                              ShowMarkers="True">
        <chart:StackingAreaSeries.MarkerSettings>
            <chart:ChartMarkerSettings Type="Diamond"
                                       Fill="LightBlue"
                                       Stroke="Blue"
                                       StrokeWidth="1"
                                       Height="8"
                                       Width="8"/>
        </chart:StackingAreaSeries.MarkerSettings>
    </chart:StackingAreaSeries>
    ...
</chart:SfCartesianChart>
SfCartesianChart chart = new SfCartesianChart();
...
// Configure chart marker settings, defining appearance and style
ChartMarkerSettings chartMarker= new ChartMarkerSettings()
{
Type = ShapeType.Diamond,
Fill = Colors.LightBlue,
Stroke = Colors.Blue,
StrokeWidth = 1,
Height = 8,
Width = 8
};
StackingAreaSeries series = new StackingAreaSeries()
{
ItemsSource = new ViewModel().Data,
XBindingPath = "Year",
YBindingPath = "Value",
ShowMarkers = true,
MarkerSettings = chartMarker // Apply the defined marker settings to the series
};
...
chart.Series.Add(series);
this.Content = chart;