Candle Chart in .NET MAUI Chart
Candle Chart
Candle charts are a type of financial chart used to represent the price movement of an asset over time. The chart is made up of a series of rectangular bars, called candlesticks, that represent a specific time, typically one day. To render a candle chart, create an instance of CandleSeries, and add it to the Series collection property of SfCartesianChart.
NOTE
The Cartesian chart has Series as its default content.
To plot a point on a candlestick chart, a collection of five values is required, including the X-value, open value, high value, low value, and close value. You can use the below collection.
ObservableCollection<Model> StockData = new ObservableCollection<Model>();
StockData.Add(new Model { Year = "2000", High = 50, Low = 40, Open = 47, Close = 45 });
StockData.Add(new Model { Year = "2001", High = 50, Low = 35, Open = 45, Close = 40 });
StockData.Add(new Model { Year = "2002", High = 40, Low = 30, Open = 37, Close = 40 });
StockData.Add(new Model { Year = "2003", High = 50, Low = 35, Open = 40, Close = 45 });
StockData.Add(new Model { Year = "2004", High = 45, Low = 30, Open = 35, Close = 32 });
StockData.Add(new Model { Year = "2005", High = 50, Low = 35, Open = 40, Close = 45 });
StockData.Add(new Model { Year = "2006", High = 40, Low = 31, Open = 36, Close = 34 });
StockData.Add(new Model { Year = "2007", High = 48, Low = 38, Open = 43, Close = 40 });
StockData.Add(new Model { Year = "2008", High = 55, Low = 45, Open = 48, Close = 50 });
StockData.Add(new Model { Year = "2009", High = 45, Low = 30, Open = 35, Close = 40 });
StockData.Add(new Model { Year = "2010", High = 50, Low = 40, Open = 40, Close = 35 });
<chart:SfCartesianChart>
<chart:SfCartesianChart.XAxes>
<chart:CategoryAxis/>
</chart:SfCartesianChart.XAxes>
<chart:SfCartesianChart.YAxes>
<chart:NumericalAxis/>
</chart:SfCartesianChart.YAxes>
<chart:CandleSeries ItemsSource="{Binding StockData}"
XBindingPath="Year"
Open="Open"
High="High"
Low="Low"
Close="Close"/>
</chart:SfCartesianChart>
Bull and Bear Color
In the Candle chart, the BullishFill property is used to specify a fill color for the segments that indicates an increase in the stock price in the measured time interval, and the BearishFill property is used to specify a fill color for the segments that indicates a decrease in the stock price in the measured time interval.
<chart:SfCartesianChart>

    <chart:SfCartesianChart.XAxes>
        <chart:CategoryAxis/>
    </chart:SfCartesianChart.XAxes>

    <chart:SfCartesianChart.YAxes>
        <chart:NumericalAxis/>
    </chart:SfCartesianChart.YAxes>

    <chart:CandleSeries ItemsSource="{Binding StockData}"
                        XBindingPath="Year"
                        Open="Open"
                        High="High"
                        Low="Low"
                        Close="Close"
                        BullishFill="Blue"
                        BearishFill="Yellow"/>

</chart:SfCartesianChart>
SfCartesianChart chart = new SfCartesianChart();
CategoryAxis primaryAxis = new CategoryAxis();
chart.XAxes.Add(primaryAxis);
NumericalAxis secondaryAxis = new NumericalAxis();
chart.YAxes.Add(secondaryAxis);
CandleSeries series = new CandleSeries()
{
ItemsSource = new ViewModel().StockData,
XBindingPath = "Year",
Open = "Open",
High = "High",
Low = "Low",
Close = "Close",
BullishFill = Colors.Blue, // Set the color of the candlestick for bullish (price up) scenarios.
BearishFill = Colors.Yellow, // Set the color of the candlestick for bearish (price down) scenarios.
};
chart.Series.Add(series);
this.Content = chart;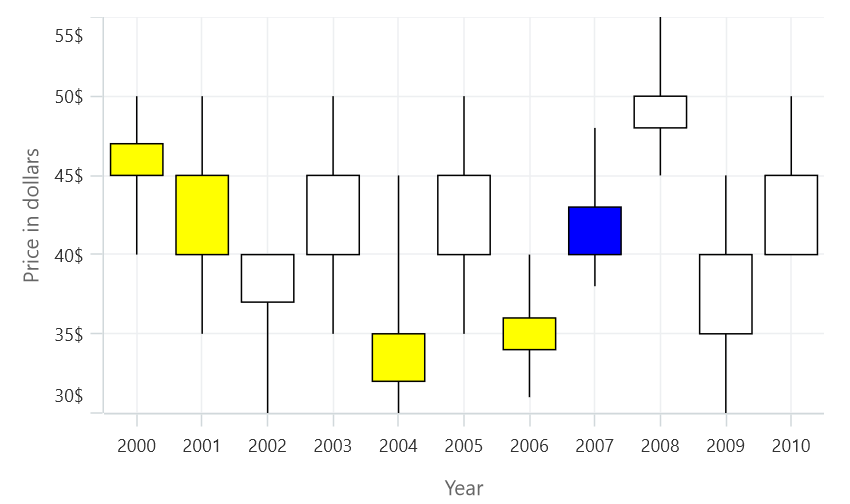
EnableSolidCandle
In Candle Series, the EnableSolidCandle property is used to specify whether the candle segment should be filled or hollow. The default value of this property is false.
<chart:SfCartesianChart>

    <chart:SfCartesianChart.XAxes>
        <chart:CategoryAxis/>
    </chart:SfCartesianChart.XAxes>

    <chart:SfCartesianChart.YAxes>
        <chart:NumericalAxis/>
    </chart:SfCartesianChart.YAxes>

    <chart:CandleSeries ItemsSource="{Binding StockData}"
                        XBindingPath="Year"
                        Open="Open"
                        High="High"
                        Low="Low"
                        Close="Close"
                        EnableSolidCandle="True"/>

</chart:SfCartesianChart>
SfCartesianChart chart = new SfCartesianChart();
CategoryAxis primaryAxis = new CategoryAxis();
chart.XAxes.Add(primaryAxis);
NumericalAxis secondaryAxis = new NumericalAxis();
chart.YAxes.Add(secondaryAxis);
CandleSeries series = new CandleSeries()
{
ItemsSource = new ViewModel().StockData,
XBindingPath = "Year",
Open = "Open",
High = "High",
Low = "Low",
Close = "Close",
EnableSolidCandle = true, // Enable solid candles in the series for a more filled appearance
};
chart.Series.Add(series);
this.Content = chart;