Area Chart in .NET MAUI Chart
Area Chart
The area chart is rendered by using a collection of line segments connected to form a closed loop area, filled with the specified color. To render a area chart, create an instance of AreaSeries and add it to the Series collection property of the chart.
NOTE
The Cartesian chart has Series as its default content.
<chart:SfCartesianChart>

    <chart:SfCartesianChart.XAxes>
        <chart:CategoryAxis/>
    </chart:SfCartesianChart.XAxes>

    <chart:SfCartesianChart.YAxes>
        <chart:NumericalAxis/>
    </chart:SfCartesianChart.YAxes>

    <chart:AreaSeries ItemsSource="{Binding Data}"
                      XBindingPath="Demand"
                      YBindingPath="Year2010"/>

</chart:SfCartesianChart>
SfCartesianChart chart = new SfCartesianChart();
CategoryAxis primaryAxis = new CategoryAxis();
chart.XAxes.Add(primaryAxis);
NumericalAxis secondaryAxis = new NumericalAxis();
chart.YAxes.Add(secondaryAxis);
// Create a AreaSeries for the chart
AreaSeries series = new AreaSeries()
{
ItemsSource = new ViewModel().Data,
XBindingPath = "Demand",
YBindingPath = "Year2010",
};
// Add the series to the chart's series collection
chart.Series.Add(series);
this.Content = chart;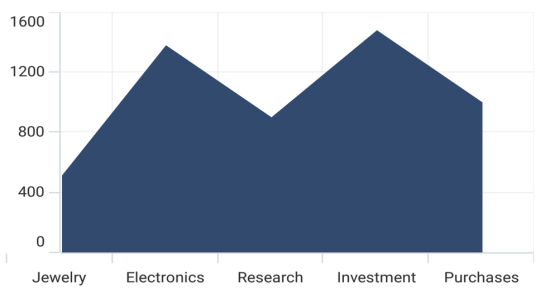
Spline Area Chart
The SplineAreaSeries connects a series of data points using smooth bezier line curves, with the underlying areas filled.
<chart:SfCartesianChart>

    <chart:SfCartesianChart.XAxes>
        <chart:CategoryAxis/>
    </chart:SfCartesianChart.XAxes>

    <chart:SfCartesianChart.YAxes>
        <chart:NumericalAxis/>
    </chart:SfCartesianChart.YAxes>

    <chart:SplineAreaSeries ItemsSource="{Binding Data}"
                            XBindingPath="Demand"
                            YBindingPath="Year2010"/>

</chart:SfCartesianChart>
SfCartesianChart chart = new SfCartesianChart();
CategoryAxis primaryAxis = new CategoryAxis();
chart.XAxes.Add(primaryAxis);
NumericalAxis secondaryAxis = new NumericalAxis();
chart.YAxes.Add(secondaryAxis);
// Create a SplineAreaSeries for the chart
SplineAreaSeries series = new SplineAreaSeries()
{
ItemsSource = new ViewModel().Data,
XBindingPath = "Demand",
YBindingPath = "Year2010",
};
// Add the series to the chart's series collection
chart.Series.Add(series);
this.Content = chart;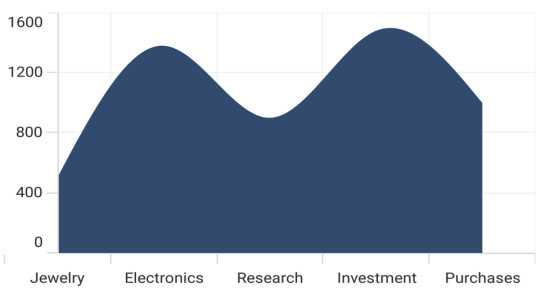
Enable Marker
A marker, also known as a symbol, is used to determine or highlight the position of the data point. To enable markers in the series, set the ShowMarkers property to true.
<chart:SfCartesianChart>
    ...
    <chart:AreaSeries ItemsSource="{Binding Data}"
                      XBindingPath="Year"
                      YBindingPath="Percentage"
                      ShowMarkers="True"/>
</chart:SfCartesianChart>
SfCartesianChart chart = new SfCartesianChart();
...
AreaSeries series = new AreaSeries()
{
ItemsSource = new ViewModel().Data,
XBindingPath = "Year",
YBindingPath = "Percentage",
ShowMarkers = true, // Enable markers on data points for better visibility
};
chart.Series.Add(series);
this.Content= chart;Marker customization
In order to change the series markers appearance, create an instance of the MarkerSettings property. The following properties are used to customize marker appearance.
-
Type, of type
ShapeType, describes the shape of the series marker. The default value of this property is ShapeType.Circle. -
Stroke, of type
Brush, indicates the brush used to paint the marker border. -
StrokeWidth, of type
double, indicates the width of the marker border. -
Fill, of type
Brush, indicates the color of the marker. -
Width, of type
double, indicates the width of the marker. -
Height, of type
double, indicates the height of the marker.
<chart:SfCartesianChart>
    ...
    <chart:AreaSeries ItemsSource="{Binding Data}"
                      XBindingPath="Year"
                      YBindingPath="Percentage"
                      ShowMarkers="True">
        <chart:AreaSeries.MarkerSettings>
            <chart:ChartMarkerSettings Type="Diamond"
                                       Fill="Brown"
                                       Stroke="Black"
                                       StrokeWidth="1"
                                       Height="8"
                                       Width="8"/>
        </chart:AreaSeries.MarkerSettings>
    </chart:AreaSeries>
</chart:SfCartesianChart>
SfCartesianChart chart = new SfCartesianChart();
...
// Configure the marker settings for the chart series
ChartMarkerSettings chartMarker= new ChartMarkerSettings()
{
Type = ShapeType.Diamond,
Fill = Colors.Brown,
Stroke = Colors.Black,
StrokeWidth = 1,
Height = 8,
Width = 8
};
AreaSeries series = new AreaSeries()
{
ItemsSource = new ViewModel().Data,
XBindingPath = "Year",
YBindingPath = "Percentage",
ShowMarkers = true,
MarkerSettings = chartMarker // Apply the configured marker settings
};
chart.Series.Add(series);
this.Content = chart;