How can I help you?
StackedArea100 Chart in .NET MAUI Chart
The stacked area 100% chart enables users to visually represent data points vertically, one above the other, to indicate the cumulative value of the data points at 100%.
StackedArea100 Chart
To render the StackedArea100 chart, create an instance of the StackingArea100Series, and add it to the Series collection property of the SfCartesianChart.
NOTE
The Cartesian chart has a Series as its default content.
<chart:SfCartesianChart>

    <chart:SfCartesianChart.XAxes>
        <chart:CategoryAxis/>
    </chart:SfCartesianChart.XAxes>

    <chart:SfCartesianChart.YAxes>
        <chart:NumericalAxis/>
    </chart:SfCartesianChart.YAxes>

    <chart:StackingArea100Series ItemsSource="{Binding Data1}"
                                XBindingPath="Year"
                                YBindingPath="Value"/>

    <chart:StackingArea100Series ItemsSource="{Binding Data2}"
                                XBindingPath="Year"
                                YBindingPath="Value"/>

    <chart:StackingArea100Series ItemsSource="{Binding Data3}"
                                XBindingPath="Year"
                                YBindingPath="Value"/>

    <chart:StackingArea100Series ItemsSource="{Binding Data4}"
                                XBindingPath="Year"
                                YBindingPath="Value"/>

</chart:SfCartesianChart>
SfCartesianChart chart = new SfCartesianChart();
CategoryAxis primaryAxis = new CategoryAxis();
chart.XAxes.Add(primaryAxis);
NumericalAxis secondaryAxis = new NumericalAxis();
chart.YAxes.Add(secondaryAxis);
ViewModel viewModel = new ViewModel();
// Create a StackingArea100Series for the chart
StackingArea100Series series1 = new StackingArea100Series()
{
XBindingPath = "Year",
YBindingPath = "Value",
ItemsSource = viewModel.Data1
};
StackingArea100Series series2 = new StackingArea100Series()
{
XBindingPath = "Year",
YBindingPath = "Value",
ItemsSource = viewModel.Data2
};
StackingArea100Series series3 = new StackingArea100Series()
{
XBindingPath = "Year",
YBindingPath = "Value",
ItemsSource = viewModel.Data3
};
StackingArea100Series series4 = new StackingArea100Series()
{
XBindingPath = "Year",
YBindingPath = "Value",
ItemsSource = viewModel.Data4
};
// Add the all series to the chart
chart.Series.Add(series1);
chart.Series.Add(series2);
chart.Series.Add(series3);
chart.Series.Add(series4);
this.Content = chart;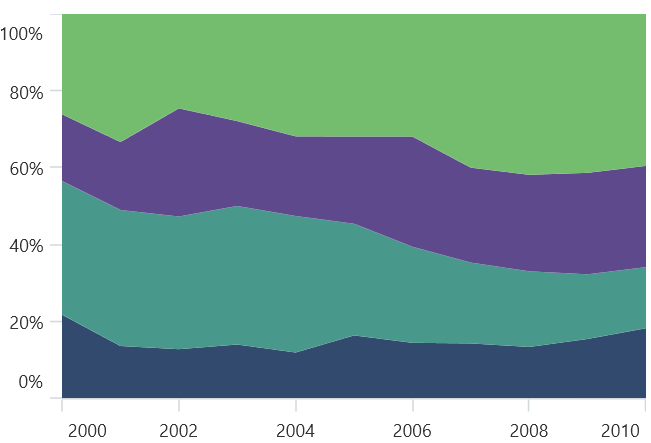
Enable Marker
A marker, also known as a symbol, is used to determine or highlight the position of the data point. To enable markers in the series, set the ShowMarkers property to true.
<chart:SfCartesianChart>
    ...
    <chart:StackingArea100Series ItemsSource="{Binding Data}"
                                 XBindingPath="Year"
                                 YBindingPath="Value"
                                 ShowMarkers="True"/>
</chart:SfCartesianChart>
SfCartesianChart chart = new SfCartesianChart();
...
StackingArea100Series series = new StackingArea100Series()
{
ItemsSource = new ViewModel().Data,
XBindingPath = "Year",
YBindingPath = "Value",
ShowMarkers = true // Display markers on the series
};
chart.Series.Add(series);
this.Content = chart;Marker customization
In order to change the series markers appearance, create an instance of the MarkerSettings property. The following properties are used to customize marker appearance.
-
Type, of type
ShapeType, describes the shape of the series marker. The default value of this property is the ShapeType.Circle. -
Stroke, of type
Brush, indicates the brush used to paint the marker border. -
StrokeWidth, of type
double, indicates the width of the marker border. -
Fill, of type
Brush, indicates the color of the marker. -
Width, of type
double, indicates the width of the marker. -
Height, of type
double, indicates the height of the marker.
<chart:SfCartesianChart>
    ...
    <chart:StackingArea100Series ItemsSource="{Binding Data}"
                                 XBindingPath="Year"
                                 YBindingPath="Value"
                                 ShowMarkers="True">
        <chart:StackingArea100Series.MarkerSettings>
            <chart:ChartMarkerSettings Type="Diamond"
                                       Fill="LightBlue"
                                       Stroke="Blue"
                                       StrokeWidth="1"
                                       Height="8"
                                       Width="8"/>
        </chart:StackingArea100Series.MarkerSettings>
    </chart:StackingArea100Series>
    ...
</chart:SfCartesianChart>
SfCartesianChart chart = new SfCartesianChart();
...
// Configure chart marker settings, defining appearance and style
ChartMarkerSettings chartMarker= new ChartMarkerSettings()
{
Type = ShapeType.Diamond,
Fill = Colors.LightBlue,
Stroke = Colors.Blue,
StrokeWidth = 1,
Height = 8,
Width = 8
};
StackingArea100Series series = new StackingArea100Series()
{
ItemsSource = new ViewModel().Data,
XBindingPath = "Year",
YBindingPath = "Value",
ShowMarkers = true,
MarkerSettings = chartMarker // Apply the defined marker settings to the series
};
...
chart.Series.Add(series);
this.Content = chart;