Series customization in Flutter Pyramid Chart
18 Nov 201814 minutes to read
Animation
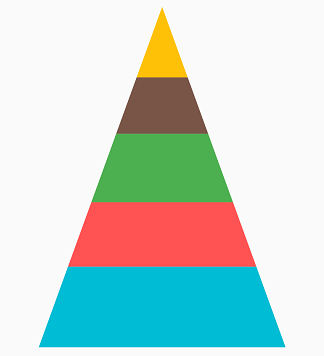
SfPyramidChart provides animation support for the series. The series animates while rendering. Animation is enabled by default, and you can also control the duration of the animation using the animationDuration property. You can disable the animation by setting the value to 0.
@override
    Widget build(BuildContext context) {
        return Scaffold(
            body: Center(
                child: Container(
                    child: SfPyramidChart(
                        series:PyramidSeries<ChartData, String>(
                            dataSource: chartData,
                            xValueMapper: (ChartData data, _) => data.x,
                            yValueMapper: (ChartData data, _) => data.y,
                            animationDuration: 1000,
                        )
                    )
                )
            )
        );
    }
Animation delay
The animationDelay property is used to specify the delay duration of the series animation. This takes a millisecond value as input. By default, the series animates for the specified duration. If animationDelay is specified, then the series begins to animate after the specified duration. Defaults to 0.
@override
    Widget build(BuildContext context) {
        final List<ChartData> data = [
            ChartData('Jan', 35),
            ChartData('Feb', 28),
            ChartData('Mar', 38),
            ChartData('Apr', 32),
            ChartData('May', 40)
        ];

        return Center(
            child: SfPyramidChart(
                series: PyramidSeries<ChartData, String>(
                    dataSource: data,
                    animationDuration: 4500,
                    animationDelay: 2000,
                    xValueMapper: (ChartData data, _) => data.x,
                    yValueMapper: (ChartData data, _) => data.y,
                )
            ),
        );
    }

    class ChartData {
      ChartData(this.x, this.y);
      final String x;
      final double y;
    }
Empty points
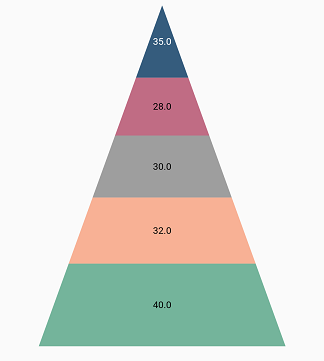
The data points that have null values are considered as empty points. Empty data points are ignored and not plotted in the chart. By using emptyPointSettings property in series, you can decide the action taken for empty points. Available modes are EmptyPointMode.gap, EmptyPointMode.zero, EmptyPointMode.drop and EmptyPointMode.average. Default mode of the empty point is EmptyPointMode.gap.
@override
    Widget build(BuildContext context) {

         final List<ChartData> chartData = [
            ChartData('Jan', 35),
            ChartData('Feb', 28),
            ChartData('Mar', null),
            ChartData('Apr', 32),
            ChartData('May', 40)
        ];
        return Scaffold(
            body: Center(
                child: SfPyramidChart(
                    series:PyramidSeries<ChartData, String>(
                        dataSource: chartData,
                        dataLabelSettings: DataLabelSettings(isVisible:true),
                        emptyPointSettings: EmptyPointSettings(mode: EmptyPointMode.average),
                        xValueMapper: (ChartData data, _) => data.x,
                        yValueMapper: (ChartData data, _) => data.y
                    )
                )
            )
        );
    }
Empty point customization
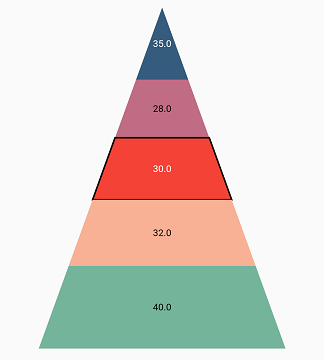
Specific color for empty points can be set by color property in emptyPointSettings. The borderWidth property is used to change the stroke width of the empty point and borderColor is used to change the stroke color of the empty point.
@override
    Widget build(BuildContext context) {
        final List<ChartData> chartData = [
            ChartData('Jan', 35),
            ChartData('Feb', 28),
            ChartData('Mar', null),
            ChartData('Apr', 32),
            ChartData('May', 40)
        ];
        return Scaffold(
            body: Center(
                child: Container(
                    child: SfPyramidChart(
                        series:PyramidSeries<ChartData, String>(
                            dataSource: chartData,
                            dataLabelSettings: DataLabelSettings(isVisible:true),
                            emptyPointSettings: EmptyPointSettings(mode: EmptyPointMode.average,
                            color: Colors.red,
                            borderColor: Colors.black,
                            borderWidth: 2),
                            xValueMapper: (ChartData data, _) => data.x,
                            yValueMapper: (ChartData data, _) => data.y
                        )
                    )
                )
            )
        );
    }
Color mapping for data points
The pointColorMapper property is used to map the color field from the data source.
@override
    Widget build(BuildContext context) {
            List<ChartData> chartData = <ChartData>[
                ChartData('Rent', 1000,Colors.teal),
                ChartData('Food', 2500,Colors.lightBlue),
                ChartData('Savings', 760,Colors.brown),
                ChartData('Tax', 1897,Colors.grey),
                ChartData('Others', 2987,Colors.blueGrey)
            ];
            return Scaffold(
                body: Center(
                    child: Container(
                        child: SfPyramidChart(
                        series:PyramidSeries<ChartData, String>(
                            dataSource: chartData,
                            xValueMapper: (ChartData data, _) => data.x,
                            yValueMapper: (ChartData data, _) => data.y,
                            //Map color for each dataPoint in datasource.
                            pointColorMapper: (ChartData data,_) => data.color,
                        )
                    )
                )
            )
        );
    }