Customization in Flutter Pyramid Chart (SfPyramidChart)
20 Jul 202521 minutes to read
To render a pyramid chart, create an instance of PyramidSeries, and add it to the series property of SfPyramidChart. The following properties can be used to customize the appearance of a pyramid segment.
-
opacity- controls the transparency of the chart series. -
borderWidth- changes the stroke width of the series. -
borderColor- changes the stroke color of the series. -
pointColorMapper- maps the color from data source.
@override
    Widget build(BuildContext context) {
        return Scaffold(
            body: Center(
                child: Container(
                    child: SfPyramidChart(
                        series: PyramidSeries<ChartData, String>(
                            dataSource: [
                                ChartData('Walnuts', 654),
                                ChartData('Almonds', 575),
                                ChartData('Soybeans', 446),
                                ChartData('Black beans', 341),
                                ChartData('Mushrooms', 296),
                                ChartData('Avocado', 160),
                            ],
                            xValueMapper: (ChartData data, _) => data.x,
                            yValueMapper: (ChartData data, _) => data.y)
                    )
                )
            )
        );
    }

    class ChartData {
        ChartData(this.x, this.y);
            final String x;
            final double y;
    }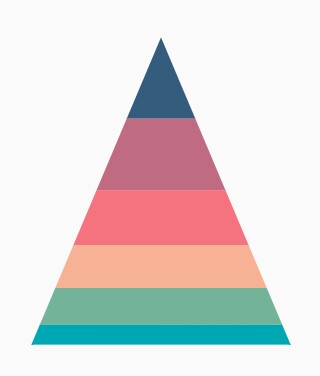
Pyramid modes
You can render the pyramid series as PyramidMode.linear or PyramidMode.surface mode. In linear mode, the height of the pyramid segment is based on the Y value, and in surface mode, the area of the pyramid segment is based on the Y value. The default value of PyramidMode property is PyramidMode.linear.
@override
    Widget build(BuildContext context) {
        return Scaffold(
            body: Center(
                child: Container(
                    child: SfPyramidChart(
                        series: PyramidSeries<ChartData, String>(
                            pyramidMode: PyramidMode.surface,
                            dataSource: [
                                ChartData('Walnuts', 654),
                                ChartData('Almonds', 575),
                                ChartData('Soybeans', 446),
                                ChartData('Black beans', 341),
                                ChartData('Mushrooms', 296),
                                ChartData('Avocado', 160),
                            ],
                            xValueMapper: (ChartData data, _) => data.x,
                            yValueMapper: (ChartData data, _) => data.y)
                        )
                    )
                )
            );
        }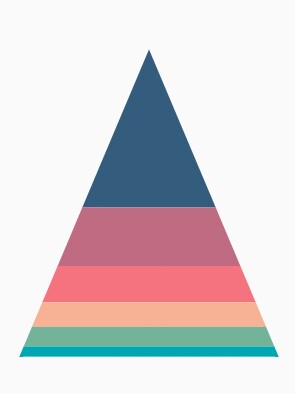
Changing pyramid size
You can modify the size of pyramid series using the height and width properties. It ranges from 0% to 100%.
@override
    Widget build(BuildContext context) {
        return Scaffold(
            body: Center(
                child: Container(
                    child: SfPyramidChart(
                        series: PyramidSeries<ChartData, String>(
                            height: '50%',
                            width: '50%',
                            dataSource: [
                                ChartData('Walnuts', 654),
                                ChartData('Almonds', 575),
                                ChartData('Soybeans', 446),
                                ChartData('Black beans', 341),
                                ChartData('Mushrooms', 296),
                                ChartData('Avocado', 160),
                            ],
                            xValueMapper: (ChartData data, _) => data.x,
                            yValueMapper: (ChartData data, _) => data.y)
                        )
                    )
                )
            );
        }
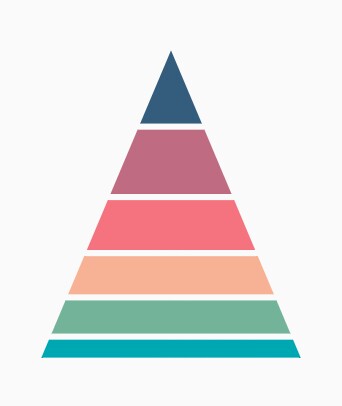
Gap between segments
You can control the gap between the two segments using the gapRatio property. It ranges from 0 to 1.
@override
    Widget build(BuildContext context) {
        return Scaffold(
            body: Center(
                child: Container(
                    child: SfPyramidChart(
                        series: PyramidSeries<ChartData, String>(
                            gapRatio: 0.1,
                            dataSource: [
                                ChartData('Walnuts', 654),
                                ChartData('Almonds', 575),
                                ChartData('Soybeans', 446),
                                ChartData('Black beans', 341),
                                ChartData('Mushrooms', 296),
                                ChartData('Avocado', 160),
                            ],
                            xValueMapper: (ChartData data, _) => data.x,
                            yValueMapper: (ChartData data, _) => data.y)
                        )
                    )
                )
            );
        }
Explode segments
You can explode a specific pyramid segment using the explodeIndex property. The explodeOffset property is used to specify the exploded segment’s distance.
Also, the segments can be exploded by tapping the segment.
@override
    Widget build(BuildContext context) {
        return Scaffold(
            body: Center(
                child: Container(
                    child: SfPyramidChart(
                        series: PyramidSeries<ChartData, String>(
                            explode: true,
                            explodeOffset: '5%',
                            explodeIndex: 2,
                            dataSource: [
                                ChartData('Walnuts', 654),
                                ChartData('Almonds', 575),
                                ChartData('Soybeans', 446),
                                ChartData('Black beans', 341),
                                ChartData('Mushrooms', 296),
                                ChartData('Avocado', 160),
                            ],
                            xValueMapper: (ChartData data, _) => data.x,
                            yValueMapper: (ChartData data, _) => data.y)
                        )
                    )
                )
            );
        }
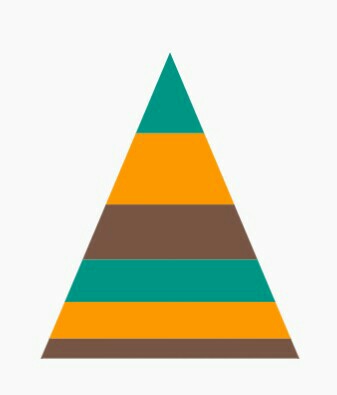
Applying palette color
The palette property is used to define colors for the series available in chart. By default, a set of 10 colors is predefined for applying it to the series. If the colors specified in the series are less than the number of series, then the remaining series will be filled with the specified palette colors rotationally.
@override
    Widget build(BuildContext context) {
        return Scaffold(
            body: Center(
                child: Container(
                    child: SfPyramidChart(
                        palette: <Color>[
                            Colors.teal,
                            Colors.orange,
                            Colors.brown
                        ],
                        series: PyramidSeries<ChartData, String>(
                            dataSource: [
                                ChartData('Walnuts', 654),
                                ChartData('Almonds', 575),
                                ChartData('Soybeans', 446),
                                ChartData('Black beans', 341),
                                ChartData('Mushrooms', 296),
                                ChartData('Avocado', 160),
                            ],
                            xValueMapper: (ChartData data, _) => data.x,
                            yValueMapper: (ChartData data, _) => data.y)
                    )
                )
            )
        );
    }