Legend in WPF Maps (SfMap)
9 Jul 202612 minutes to read
A legend is a key to symbolism used on a map, usually containing swatches of symbols with descriptions. It provides valuable information for interpreting what the map is showing you, and can be represented in various colors and shapes based on the data.
Legend visibility
Legends are visible by setting the LegendVisibility property of the visibility type as Visible in the ShapeFileLayer.
Legend Position
Map legends can be positioned by setting the LegendPosition property in ShapeFileLayer. Also, the legend can be positioned based on the margin values for the X-axis and the Y-axis with the help of the LegendPositionX and LegendPositionY properties available in ShapeFileLayer. For positioning the legend based on margins corresponding to a map, LegendPosition must be set with the value Default.
| Property | Type | Description |
|---|---|---|
| LegendPosition | LegendPosition (enum) | Gets or sets the standard position for the legend. |
| LegendPositionX | Double | Gets or sets the margin value for the X-axis. |
| LegendPositionY | Double | Gets or sets the margin value for the Y-axis. |
Legend header
A header for the legend can be added by setting the LegendHeader property of the string type.
Legend categories
Legends are categorized into two types:
- Legends for shape layers.
- Legends for bubbles.
These can be set by using the LegendType property of the type LegendType.
Bubbles
Bubble type legends are always bubbles with varying sizes. The size of the bubbles is obtained from the SizeRatio from the BubbleMarkerSetting.
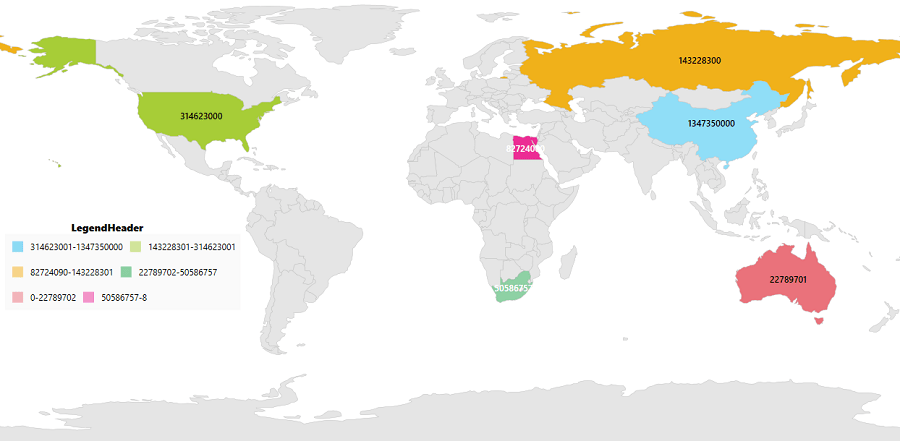
Shapes
Layer shape type legends can be different shapes for the legend. The shapes can be set by using the LegendIcon, of the LegendIcon type.
Arranging the Legends
Legends are arranged in matrix format. The number of columns in the arranging matrix can be set by setting the LegendColumnSplit property of the int type.
<syncfusion:SfMap>
        <syncfusion:SfMap.Layers>
            <syncfusion:ShapeFileLayer
                    LegendType="Layers" LegendHeader="LegendHeader"
                    LegendColumnSplit="2" LegendPositionX="10"
                    LegendPositionY="300" LegendVisibility="Visible"
                    LegendIcon="Rectangle" ItemsSource="{Binding Countries}" ShapeIDPath="Name"
                    ShapeIDTableField="NAME" Uri="DataMarkers.ShapeFiles.world1.shp">
                <syncfusion:ShapeFileLayer.ShapeSettings>
                    <syncfusion:ShapeSetting ShapeColorValuePath="Population" ShapeFill="#E5E5E5"
                                                 ShapeStroke="#C1C1C1" ShapeStrokeThickness="0.5"
                                                 ShapeValuePath="Population" >
                        <syncfusion:ShapeSetting.FillSetting>
                            <syncfusion:ShapeFillSetting AutoFillColors="False">
                                <syncfusion:ShapeFillSetting.ColorMappings>
                                    <syncfusion:RangeColorMapping Color="#7F20BCEE" To="1347350000" From="314623001"/>
                                    <syncfusion:RangeColorMapping Color="#7FA7CE38" To="314623001" From="143228301"/>
                                    <syncfusion:RangeColorMapping Color="#7FF1B21A" To="143228301" From="82724090"/>
                                    <syncfusion:RangeColorMapping Color="#7F1DA249" To="50586757" From="22789702"/>
                                    <syncfusion:RangeColorMapping Color="#7FEB737C" To="22789702" From="0"/>
                                    <syncfusion:RangeColorMapping Color="#7FED2D95" To="82724090" From="50586757"/>
                                </syncfusion:ShapeFillSetting.ColorMappings>
                            </syncfusion:ShapeFillSetting>
                        </syncfusion:ShapeSetting.FillSetting>
                    </syncfusion:ShapeSetting>
                </syncfusion:ShapeFileLayer.ShapeSettings>
            </syncfusion:ShapeFileLayer>
        </syncfusion:SfMap.Layers>
    </syncfusion:SfMap>
public class Country
{
private string name;
public string Name
{
get { return name; }
set { name = value; }
}
private double population;
public double Population
{
get { return population; }
set { population = value; }
}
}
public class ViewModel
{
private ObservableCollection<Country> countries;
public ObservableCollection<Country> Countries
{
get { return countries; }
set { countries = value; }
}
public ViewModel()
{
Countries = new ObservableCollection<Country>
{
new Country { Name = "Russia", Population = 143228300},
new Country { Name = "China", Population = 1347350000 },
new Country { Name = "Australia", Population = 22789701 },
new Country { Name = "South Africa", Population = 50586757},
new Country { Name = "United States", Population = 314623000 },
new Country { Name = "Egypt", Population = 82724000},
};
}
}
<syncfusion:SfMap>
        <syncfusion:SfMap.Layers>
            <syncfusion:ShapeFileLayer
                    LegendType="Bubbles" LegendHeader="LegendHeader"
                    LegendColumnSplit="2" LegendPositionX="10"
                    LegendPositionY="300" LegendVisibility="Visible"
                    LegendIcon="Rectangle" ItemsSource="{Binding Countries}" ShapeIDPath="Name"
                    ShapeIDTableField="NAME" Uri="DataMarkers.ShapeFiles.world1.shp">
                <syncfusion:ShapeFileLayer.ShapeSettings>
                    <syncfusion:ShapeSetting ShapeValuePath="Population"/>
                </syncfusion:ShapeFileLayer.ShapeSettings>
                <syncfusion:ShapeFileLayer.BubbleMarkerSetting>
                    <syncfusion:BubbleMarkerSetting AutoFillColor="False" MaxSize="50"
                                                    MinSize="20" StrokeThickness="0"
                                                    ColorValuePath="Population" ValuePath="Population">
                        <syncfusion:BubbleMarkerSetting.ColorMappings>
                            <syncfusion:RangeColorMapping Color="#7F20BCEE" To="1347350000" From="314623001"/>
                            <syncfusion:RangeColorMapping Color="#7FA7CE38" To="314623001" From="143228301"/>
                            <syncfusion:RangeColorMapping Color="#7FF1B21A" To="143228301" From="82724090"/>
                            <syncfusion:RangeColorMapping Color="#7FED2D95" To="82724090" From="50586757"/>
                            <syncfusion:RangeColorMapping Color="#7F1DA249" To="50586757" From="22789702"/>
                            <syncfusion:RangeColorMapping Color="#7FEB737C" To="22789702" From="0"/>
                        </syncfusion:BubbleMarkerSetting.ColorMappings>
                    </syncfusion:BubbleMarkerSetting>
                </syncfusion:ShapeFileLayer.BubbleMarkerSetting>
            </syncfusion:ShapeFileLayer>
        </syncfusion:SfMap.Layers>
    </syncfusion:SfMap>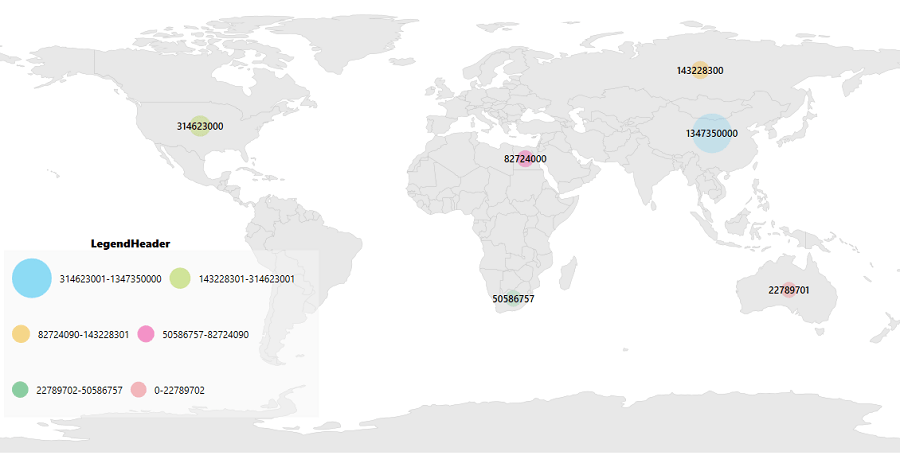
NOTE
You can refer to our WPF Map feature tour page for its groundbreaking feature representations. You can also explore our WPF Map example to know how to render and configure the map.