How can I help you?
WinUI Charts Overview (SfCircularChart)
2 Jan 20251 minute to read
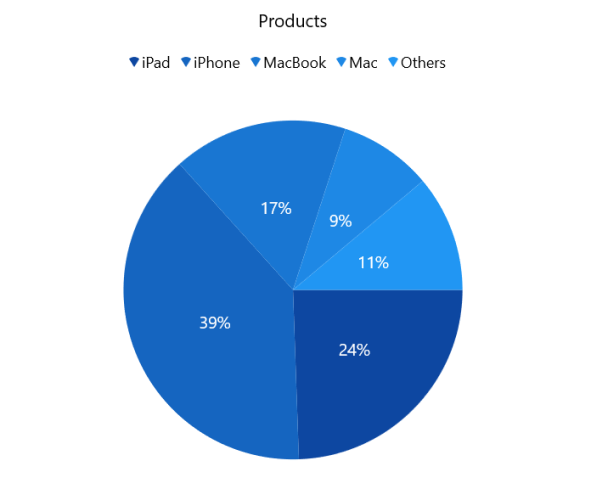
Syncfusion® WinUI Charts (SfCircularChart) is used to create the chart with beautiful and enhanced UI visualization of data that are used in high-quality WinUI applications.

Key features
-
Chart types - Supports two types of series such as pie and doughnut. Each series presents data in a unique way and it is designed to be more user-friendly.
-
User interaction - The circular chart selection, tooltips, and explode user interaction features significantly improves the end-user experience.
-
Legends - Display additional information about the data points of chart series, which can be wrapped or scrolled, if an item exceeds the available bounds.
-
Multiple series - Circular chart provides support for rendering multiple pie or doughnut series at same time, with options to compare and visualize two different series simultaneously.
-
Dynamic update - Updates the chart dynamically or lazily with live data that changes over seconds or minutes like stock prices, temperature, speed, etc.