Tooltip in .NET MAUI Maps
15 Jul 202624 minutes to read
A tooltip indicates the shape, bubble, and marker information during the tap or hover interactions. This section demonstrates how to show tooltips for the shapes, bubbles, and markers in the maps and how to customize them.
NOTE
Prerequisite: Ensure that the required NuGet package is installed, the necessary namespaces are imported, and the SfMaps control is properly configured in your application. For detailed setup and configuration instructions, refer to the Getting Started guide.
To learn more about the .NET MAUI Maps tooltip, you can check the following video.
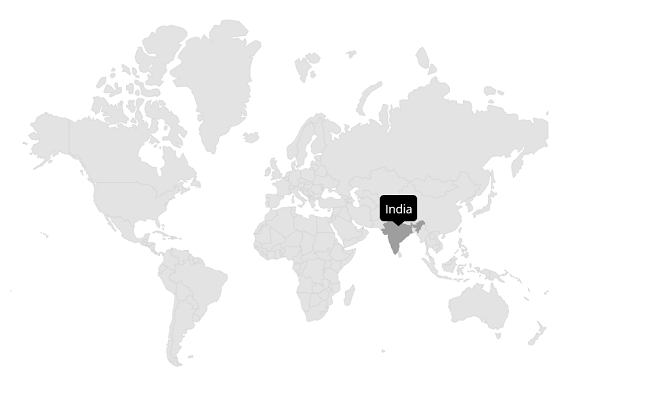
Tooltip for the shapes
The ShowShapeTooltip is used to indicate the shape information whenever you interact with the shapes, i.e., while tapping on touch devices and hovering on mouse-enabled devices.
<map:SfMaps>
    <map:SfMaps.Layer>
        <map:MapShapeLayer ShapesSource = "https://cdn.syncfusion.com/maps/map-data/world-map.json"
                           DataSource = "{Binding Data}"
                           PrimaryValuePath = "State"
                           ShapeDataField = "name"
                           ShowShapeTooltip = "True">
        </map:MapShapeLayer>
    </map:SfMaps.Layer>
</map:SfMaps>
public MainPage()
{
InitializeComponent();
ViewModel viewModel = new ViewModel();
this.BindingContext = viewModel;
MapShapeLayer layer = new MapShapeLayer();
layer.ShapesSource = MapSource.FromUri(new Uri("https://cdn.syncfusion.com/maps/map-data/world-map.json"));
layer.DataSource = viewModel.Data;
layer.PrimaryValuePath = "State";
layer.ShapeDataField = "name";
layer.ShowShapeTooltip = true;
SfMaps maps = new SfMaps();
maps.Layer = layer;
this.Content = maps;
}
public class ViewModel
{
public ObservableCollection<Model> Data { get; set; }
public ViewModel()
{
Data = new ObservableCollection<Model>();
Data.Add(new Model("India", 21));
Data.Add(new Model("United States", 58));
Data.Add(new Model("Kazakhstan", 41));
Data.Add(new Model("Italy", 48));
Data.Add(new Model("Korea", 14));
Data.Add(new Model("China", 23));
}
}
public class Model
{
public String State { get; set; }
public int Population { get; set; }
public Model(string state, int population)
{
State = state;
Population = population;
}
}
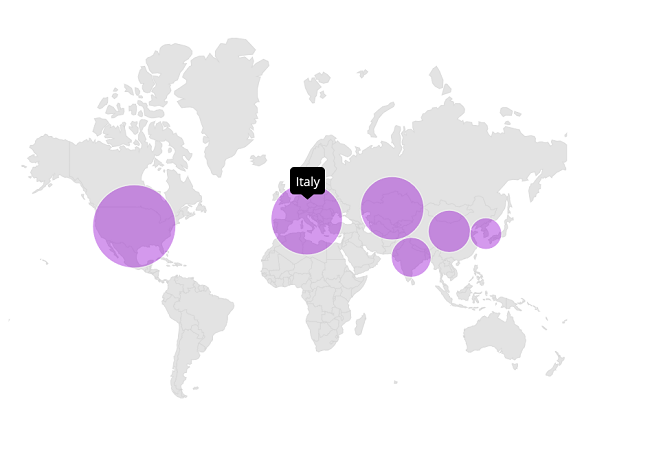
Tooltip for the bubbles
The ShowBubbleTooltip is used to indicate the bubble information whenever you interact with the bubbles, i.e., while tapping on touch devices and hovering on mouse-enabled devices.
<map:SfMaps>
    <map:SfMaps.Layer>
        <map:MapShapeLayer ShapesSource = "https://cdn.syncfusion.com/maps/map-data/world-map.json"
                           DataSource = "{Binding Data}"
                           PrimaryValuePath = "State"
                           ShapeDataField = "name"
                           ShapeHoverFill = "Transparent"
                           ShapeHoverStroke = "Transparent"
                           ShowBubbles = "True"
                           ShowBubbleTooltip = "True">

            <map:MapShapeLayer.BubbleSettings>
                <map:MapBubbleSettings ColorValuePath = "Population"
                                       SizeValuePath = "Population"
                                       Fill = "DarkViolet"
                                       MinSize = "30"
                                       MaxSize = "80">
                </map:MapBubbleSettings>
            </map:MapShapeLayer.BubbleSettings>

        </map:MapShapeLayer>
    </map:SfMaps.Layer>
</map:SfMaps>
public MainPage()
{
InitializeComponent();
ViewModel viewModel = new ViewModel();
this.BindingContext = viewModel;
MapShapeLayer layer = new MapShapeLayer();
layer.ShapesSource = MapSource.FromUri(new Uri("https://cdn.syncfusion.com/maps/map-data/world-map.json"));
layer.DataSource = viewModel.Data;
layer.PrimaryValuePath = "State";
layer.ShapeDataField = "name";
layer.ShapeHoverFill = Colors.Transparent;
layer.ShapeHoverStroke = Colors.Transparent;
layer.ShowBubbles = true;
layer.ShowBubbleTooltip = true;
MapBubbleSettings bubbleSetting = new MapBubbleSettings()
{
ColorValuePath = "Population",
SizeValuePath = "Population",
Fill = Colors.DarkViolet,
MinSize = 30,
MaxSize = 80
};
layer.BubbleSettings = bubbleSetting;
SfMaps maps = new SfMaps();
maps.Layer = layer;
this.Content = maps;
}
public class ViewModel
{
public ObservableCollection<Model> Data { get; set; }
public ViewModel()
{
Data = new ObservableCollection<Model>();
Data.Add(new Model("India", 21));
Data.Add(new Model("United States", 58));
Data.Add(new Model("Kazakhstan", 41));
Data.Add(new Model("Italy", 48));
Data.Add(new Model("Korea", 14));
Data.Add(new Model("China", 23));
}
}
public class Model
{
public String State { get; set; }
public int Population { get; set; }
public Model(string state, int population)
{
State = state;
Population = population;
}
}
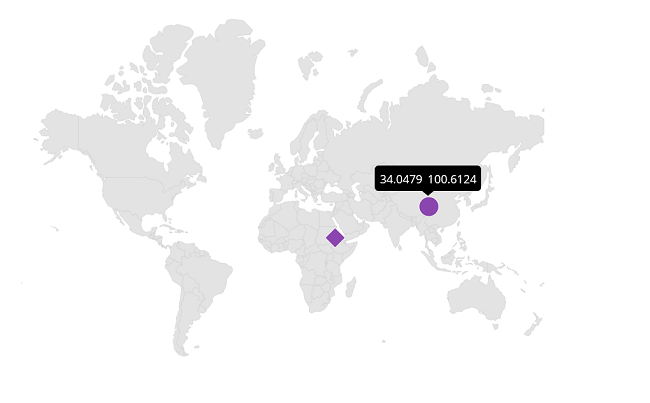
Tooltip for the markers
The ShowMarkerTooltip is used to indicate the marker information whenever you interact with the markers, i.e., while tapping on touch devices and hovering on mouse-enabled devices.
<map:SfMaps>
    <map:SfMaps.Layer>
            <map:MapShapeLayer ShapesSource = "https://cdn.syncfusion.com/maps/map-data/world-map.json"
                               ShapeStroke = "DarkGrey"
                               ShapeHoverFill = "Transparent"
                               ShapeHoverStroke = "Transparent"
                               ShowMarkerTooltip = "True">

                <map:MapShapeLayer.Markers>
                    <map:MapMarkerCollection>
                        <map:MapMarker Latitude = "36.0"
                                       IconWidth = "20"
                                       IconHeight = "20"
                                       IconType = "Diamond"
                                       Longitude = "138.2529" />
                        <map:MapMarker Latitude = "34.0479"
                                       IconWidth = "20"
                                       IconHeight = "20"
                                       IconType = "Circle"
                                       Longitude = "100.6124" />

                    </map:MapMarkerCollection>
                </map:MapShapeLayer.Markers>
            </map:MapShapeLayer>
    </map:SfMaps.Layer>
</map:SfMaps>
public MainPage()
{
InitializeComponent();
MapShapeLayer layer = new MapShapeLayer();
layer.ShapesSource = MapSource.FromUri(new Uri("https://cdn.syncfusion.com/maps/map-data/world-map.json"));
layer.ShapeHoverFill = Colors.Transparent;
layer.ShapeHoverStroke = Colors.Transparent;
layer.ShowMarkerTooltip = true;
MapMarker diamondMarker = new MapMarker();
diamondMarker.Longitude = 138.2529;
diamondMarker.Latitude = 36.0;
diamondMarker.IconHeight = 20;
diamondMarker.IconWidth = 20;
diamondMarker.IconType = MapIconType.Diamond;
MapMarker circleMarker = new MapMarker();
circleMarker.Longitude = 100.6124;
circleMarker.Latitude = 34.0479;
circleMarker.IconHeight = 20;
circleMarker.IconWidth = 20;
circleMarker.IconType = MapIconType.Circle;
MapMarkerCollection mapMarkers = new MapMarkerCollection();
mapMarkers.Add(diamondMarker);
mapMarkers.Add(circleMarker);
layer.Markers = mapMarkers;
SfMaps maps = new SfMaps();
maps.Layer = layer;
this.Content = maps;
}
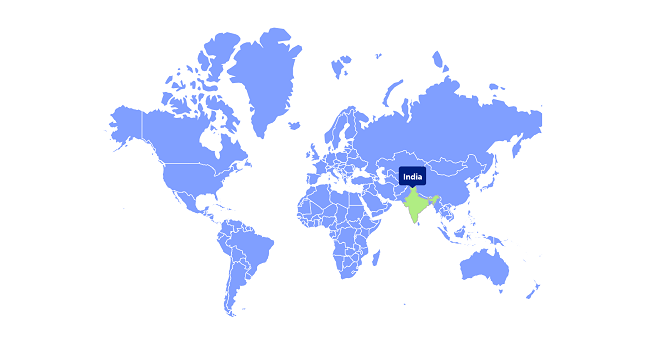
Appearance customization
Customize the tooltip appearance using the following properties.
-
Background - Change the background color of the tooltip in maps using the
MapTooltipSettings.Backgroundproperty. -
Padding - Change the padding of the tooltip text in maps using the
MapTooltipSettings.Paddingproperty. -
TextStyle - Change the tooltip text appearance such as
TextColor,FontSize,FontAttributes, andFontFamilyin maps using theMapTooltipSettings.TextStyleproperty. -
Duration - Change the duration for which the tooltip will be displayed using the
MapTooltipSettings.Durationproperty. TheDurationis aTimeSpanvalue.
<map:SfMaps>
    <map:SfMaps.Layer>
        <map:MapShapeLayer ShapesSource = "https://cdn.syncfusion.com/maps/map-data/world-map.json"
                           DataSource = "{Binding Data}"
                           PrimaryValuePath = "State"
                           ShapeDataField = "name"
                           ShapeStroke = "White"
                           ShapeStrokeThickness = "1"
                           ShapeHoverFill = "#b0ed83"
                           ShapeFill = "#809FFF"
                           ShowShapeTooltip = "True">

                <map:MapShapeLayer.ShapeTooltipSettings>
                    <map:MapTooltipSettings Background = "#002080"
                                            Duration = "00:00:02"
                                            Padding = "2">
                        <map:MapTooltipSettings.TextStyle>
                            <map:MapLabelStyle FontSize = "14"
                                               TextColor = "White"
                                               FontAttributes = "Bold">
                            </map:MapLabelStyle>
                        </map:MapTooltipSettings.TextStyle>
                    </map:MapTooltipSettings>
                </map:MapShapeLayer.ShapeTooltipSettings>
        </map:MapShapeLayer>
    </map:SfMaps.Layer>
</map:SfMaps>
public MainPage()
{
InitializeComponent();
ViewModel viewModel = new ViewModel();
this.BindingContext = viewModel;
MapShapeLayer layer = new MapShapeLayer();
layer.ShapesSource = MapSource.FromUri(new Uri("https://cdn.syncfusion.com/maps/map-data/world-map.json"));
layer.DataSource = viewModel.Data;
layer.PrimaryValuePath = "State";
layer.ShapeDataField = "name";
layer.ShapeStroke = new SolidColorBrush(Colors.White);
layer.ShapeStrokeThickness = 1;
layer.ShapeHoverFill = new SolidColorBrush(Color.FromArgb("#b0ed83"));
layer.ShapeFill = new SolidColorBrush(Color.FromArgb("#809FFF"));
layer.ShowShapeTooltip = true;
layer.ShapeTooltipSettings = new MapTooltipSettings()
{
Background = new SolidColorBrush(Color.FromArgb("#002080")),
Duration = new TimeSpan(0, 0, 2),
Padding = new Thickness(2),
TextStyle = new MapLabelStyle()
{
FontSize = 14,
TextColor = Colors.White,
FontAttributes = FontAttributes.Bold
}
};
SfMaps maps = new SfMaps();
maps.Layer = layer;
this.Content = maps;
}
public class ViewModel
{
public ObservableCollection<Model> Data { get; set; }
public ViewModel()
{
Data = new ObservableCollection<Model>();
Data.Add(new Model("India", 21));
Data.Add(new Model("United States", 58));
Data.Add(new Model("Kazakhstan", 41));
Data.Add(new Model("Italy", 48));
Data.Add(new Model("Korea", 14));
Data.Add(new Model("China", 23));
}
}
public class Model
{
public String State { get; set; }
public int Population { get; set; }
public Model(string state, int population)
{
State = state;
Population = population;
}
}
NOTE
- Refer to the
ShapeTooltipSettingsto customize the shape tooltip appearance.- Refer to the
BubbleTooltipSettingsto customize the bubble tooltip appearance.- Refer to the
MarkerTooltipSettingsto customize the marker tooltip appearance.
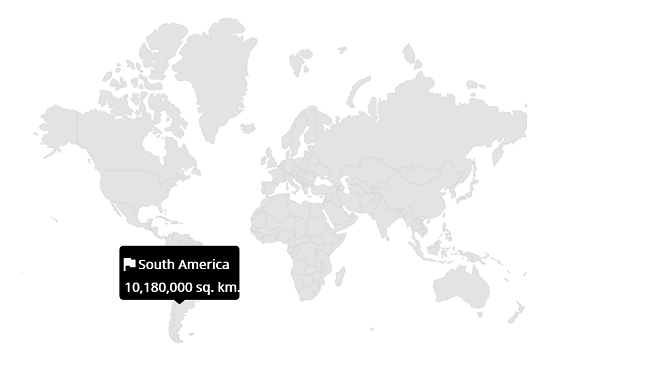
Apply data template for tooltip
Data templates can be used to customize the tooltip view using the ShapeTooltipTemplate property. The following code example shows the usage of DataTemplate.
<map:SfMaps>
    <map:SfMaps.Layer>
        <map:MapShapeLayer ShapesSource = "https://cdn.syncfusion.com/maps/map-data/world-map.json"
                           DataSource = "{Binding Data}"
                           ShapeDataField = "continent"
                           PrimaryValuePath = "Continent"
                           ShapeHoverFill = "Transparent"
                           ShapeHoverStroke = "Transparent"
                           ShowShapeTooltip = "True">

            <map:MapShapeLayer.ShapeTooltipTemplate>
                <DataTemplate>
                    <Grid>
                        <Grid.RowDefinitions>
                            <RowDefinition />
                            <RowDefinition />
                            <RowDefinition />
                        </Grid.RowDefinitions>
                        <Grid.ColumnDefinitions>
                            <ColumnDefinition />
                            <ColumnDefinition />
                        </Grid.ColumnDefinitions>
                        <Image Source = "flag.png"
                               Grid.Column = "0"
                               Grid.Row = "0"
                               WidthRequest = "20"
                               HeightRequest = "20" />
                        <Label Text = "{Binding DataItem.Continent}"
                               TextColor = "White"
                               Grid.Column = "1"
                               Grid.Row = "0"
                               Padding = "10" />
                        <Label Grid.Row = "2"
                               Grid.ColumnSpan = "2"
                               Text = "{Binding DataItem.Area}"
                               TextColor = "White" />
                    </Grid>
                </DataTemplate>
            </map:MapShapeLayer.ShapeTooltipTemplate>
        </map:MapShapeLayer>
    </map:SfMaps.Layer>
</map:SfMaps>
public ToolTip()
{
InitializeComponent();
ViewModel viewModel = new ViewModel();
this.BindingContext = viewModel;
MapShapeLayer layer = new MapShapeLayer();
layer.ShapesSource = MapSource.FromUri(new Uri("https://cdn.syncfusion.com/maps/map-data/world-map.json"));
layer.PrimaryValuePath = "Continent";
layer.ShapeDataField = "continent";
layer.DataSource = viewModel.Data;
layer.ShapeHoverFill = Colors.Transparent;
layer.ShapeHoverStroke = Colors.Transparent;
layer.ShowShapeTooltip = true;
layer.ShapeTooltipTemplate = CreateDataTemplate();
SfMaps maps = new SfMaps();
maps.Layer = layer;
this.Content = maps;
}
private DataTemplate CreateDataTemplate()
{
return new DataTemplate(() =>
{
var grid = new Grid()
{
RowDefinitions =
{
new RowDefinition (),
new RowDefinition(),
new RowDefinition()
},
ColumnDefinitions =
{
new ColumnDefinition(),
new ColumnDefinition(),
}
};
var image = new Image
{
Source = "flag.png",
WidthRequest = 20,
HeightRequest = 20
};
grid.SetRow(image, 0);
grid.SetColumn(image, 0);
var label = new Label
{
FontAttributes = FontAttributes.Bold,
TextColor = Colors.White,
Padding = 5
};
Binding binding = new Binding();
binding.Source = grid.BindingContext;
binding.Path = nameof(MapTooltipInfo.DataItem) + "." + nameof(Model.Continent);
label.SetBinding(Label.TextProperty, binding);
grid.SetRow(label, 0); grid.SetColumn(label, 1);
var areaLabel = new Label
{
FontAttributes = FontAttributes.Bold,
TextColor = Colors.White
};
grid.SetRow(areaLabel, 2);
grid.SetColumnSpan(areaLabel, 2);
Binding binding1 = new Binding();
binding1.Source = grid.BindingContext;
binding1.Path = nameof(MapTooltipInfo.DataItem) + "." + nameof(Model.Area);
areaLabel.SetBinding(Label.TextProperty, binding1);
grid.Children.Add(image);
grid.Children.Add(label);
grid.Children.Add(areaLabel);
return new ViewCell { View = grid };
});
}
public class ViewModel
{
public ObservableCollection<Model> Data { get; set; }
public ViewModel()
{
Data = new ObservableCollection<Model>
{
new Model("Asia", 130, "30,370,000 sq. km."),
new Model("Africa", 120, "24,709,000 sq. km."),
new Model("Europe", 586, "17,840,000 sq. km."),
new Model("North America", 472, "8,600,000 sq. km."),
new Model("South America", 363, "10,180,000 sq. km."),
new Model("Australia", 348, "59,180,000 sq. km."),
};
}
}
public class Model
{
public string Continent { get; set; }
public string Area { get; set; }
public int Population1 { get; set; }
public Model(string continent, int population, string area)
{
this.Continent = continent;
this.Population1 = population;
this.Area = area;
}
}
NOTE
The
BindingContextof the Tooltip will be theMapTooltipInfo, and it has theDataItemproperty. This property holds the corresponding underlying object for the shape, bubble tooltip, and the correspondingMapMarkerfor the marker tooltip.
NOTE
- Refer to the
ShapeTooltipTemplate, to customize tooltip for the shapes.- Refer to the
BubbleTooltipTemplate, to customize tooltip for the bubbles.- Refer to the
MarkerTooltipTemplate, to customize tooltip for the markers.
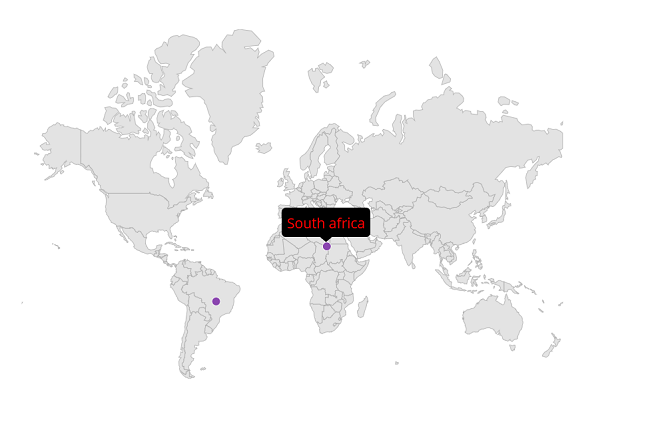
Apply data template selector for tooltip
A data template selector can also be used to customize the appearance of each item with different templates based on specific constraints. You can choose a DataTemplate for each item at runtime based on the value of data-bound property using DataTemplateSelector in ShapeTooltipTemplate.
<ContentPage.Resources>
    <ResourceDictionary>
        <DataTemplate x:Key = "SouthAfricaTemplate">
            <VerticalStackLayout IsClippedToBounds = "false"
                                 HorizontalOptions = "StartAndExpand"
                                 VerticalOptions = "Center">
                <Label Text = "{Binding DataItem.Name}"
                       Scale = "1"
                       TextColor = "Red"
                       HorizontalOptions = "StartAndExpand"
                       VerticalOptions = "Center" />
            </VerticalStackLayout>
        </DataTemplate>

        <DataTemplate x:Key = "SouthAmericaTemplate">
            <VerticalStackLayout IsClippedToBounds = "false"
                                 HorizontalOptions = "StartAndExpand"
                                 VerticalOptions = "Center">
                <Label Text = "{Binding DataItem.Name}"
                       Scale = "1"
                       TextColor = "White"
                       HorizontalOptions = "StartAndExpand"
                       VerticalOptions = "Center" />
            </VerticalStackLayout>
        </DataTemplate>

        <local:MarkerTemplateSelector x:Key = "MarkerTemplateSelector"
                                      Template1 = "{StaticResource SouthAfricaTemplate}"
                                      Template2 = "{StaticResource SouthAmericaTemplate}" />
    </ResourceDictionary>
</ContentPage.Resources>

<map:SfMaps>
    <map:SfMaps.Layer>
        <map:MapShapeLayer x:Name = "layer"
                           ShapesSource = "https://cdn.syncfusion.com/maps/map-data/world-map.json"
                           ShapeStroke = "DarkGrey"
                           ShowMarkerTooltip = "True"
                           ShapeHoverFill = "Transparent"
                           ShapeHoverStroke = "Transparent"
                           MarkerTooltipTemplate = "{StaticResource MarkerTemplateSelector}">

            <map:MapShapeLayer.Markers>
                <map:MapMarkerCollection>
                    <local:CustomMarker Name = "South africa"
                                        Latitude = "-28.5595"
                                        Longitude = "22.9375" />
                    <local:CustomMarker Name = "South America"
                                        Latitude = "-15.4915"
                                        Longitude = "-50.7832" />
                </map:MapMarkerCollection>
            </map:MapShapeLayer.Markers>

        </map:MapShapeLayer>
    </map:SfMaps.Layer>
</map:SfMaps>
public class MainPage
{
public MainPage()
{
InitializeComponent();
layer.ShapesSource = MapSource.FromUri(new Uri("https://cdn.syncfusion.com/maps/map-data/world-map.json"));
}
}
public class CustomMarker : MapMarker
{
public string Name { get; set; }
}
public class MarkerTemplateSelector : DataTemplateSelector
{
public DataTemplate Template1 { get; set; }
public DataTemplate Template2 { get; set; }
protected override DataTemplate OnSelectTemplate(object item, BindableObject container)
{
return ((CustomMarker)item).Name == "South africa" ? Template1 : Template2;
}
}
NOTE
DataTemplate and DataTemplateSelector are also applicable for bubbles and markers.
Programmatic tooltip display in .NET MAUI Maps
The .NET MAUI SfMaps allows you to display marker tooltips programmatically using the ShowTooltip method. The tooltip display duration is controlled using MarkerTooltipSettings.Duration, ensuring consistent behavior across all markers.
You can trigger tooltips either:
- Automatically when the page appears
- Sequentially using a button click for multiple markers
Example
<VerticalStackLayout Spacing = "20">

    <Button Clicked = "Button_Clicked" Text = "ShowTooltip" VerticalOptions = "Start" HorizontalOptions = "Center"/>

    <map:SfMaps>
        <map:SfMaps.Layer>
            <map:MapShapeLayer x:Name = "shapeLayer"
                               ShapesSource = "https://cdn.syncfusion.com/maps/map-data/world-map.json"
                               ShapeStroke = "DarkGrey"
                               ShowMarkerTooltip = "True"
                               ShowShapeTooltip = "True">
                <map:MapShapeLayer.Markers>
                    <map:MapMarkerCollection>
                        <!-- code omitted for brevity -->
                    </map:MapMarkerCollection>
                </map:MapShapeLayer.Markers>
                <map:MapShapeLayer.ShapeTooltipSettings>
                    <map:MapTooltipSettings Duration = "00:00:22">
                    </map:MapTooltipSettings>
                </map:MapShapeLayer.ShapeTooltipSettings>
            </map:MapShapeLayer>
        </map:SfMaps.Layer>
    </map:SfMaps>
</VerticalStackLayout>
private async void Button_Clicked(object sender, EventArgs e)
{
var markers = new List<MapMarker>
{
// code omitted for brevity
};
foreach (var marker in markers)
{
shapeLayer.ShowTooltip(marker);
await Task.Delay(4000); // Tooltip visible for 4 seconds
}
}NOTE
You can refer to our .NET MAUI Maps feature tour page for its groundbreaking feature representations. You can also explore our .NET MAUI Maps Tooltip example that shows how to configure a Maps in .NET MAUI.