.NET MAUI Maps (SfMaps) Overview
15 Jul 20264 minutes to read
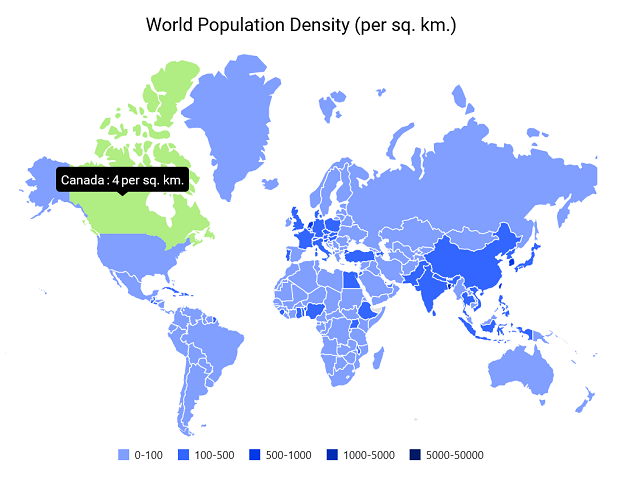
The Syncfusion® .NET MAUI Maps control is a powerful data visualization component that displays statistical information for a geographical area. It has highly interactive and customizable features such as selection, tooltip, legends, markers, bubbles, and color mapping. Using the Maps control, you can generate maps for population density, sales, political boundaries, weather, elections, and routes.
Business use cases
- Analytics applications that require visualizing geographical data such as population density, sales distribution, or regional performance.
- Logistics and tracking systems that display locations, routes, and real-time movement on maps.
- Business intelligence dashboards that use map-based visualization for better decision-making insights.
- Applications that require location tagging and highlighting specific regions or points of interest.
Key features
- Shape layer allows visualizing geographical regions using GeoJSON or shapefile data.
- Data labels allows displaying names or information for map shapes with intelligent layout handling.
- Markers allows placing symbols or custom UI elements at specific latitude and longitude locations.
- Bubbles allows representing data values using varying sizes and colors of bubbles.
- Shape selection allows highlighting specific regions and handling selection interactions.
- Legend allows explaining the data representation used in the map for better understanding.
- Colors allows categorizing and styling regions based on underlying data values or ranges.
- Tooltip allows displaying additional information for shapes, markers, and bubbles interactively.
Related controls
- TreeMap for displaying hierarchical and comparative data visualization.
- DataGrid for managing and presenting location-based data in tabular format.
- Cartesian Charts for visualizing geographical or statistical data trends using interactive charts.
See Also
- Getting Started shows a step‑by‑step guide to begin using the Maps control.
- Vector Layers lets you add line, polygon, or point layers to visualize geographic data clearly.
- UI Kit provides interactive demos and ready‑made UI examples.
Resources
Feature Tour
Get a quick overview of key features and capabilities to kick start your journey.
Explore Features
Showcase Samples
Explore real-world sample apps to see components in action and learn by example.
View Samples
Tutorial Videos
Watch step‑by‑step video guides to quickly understand concepts and implementation.
Watch now
Knowledge Base
Find practical solutions, troubleshooting tips and how‑to guides for common scenarios.
Search KB's