Bubbles in .NET MAUI Maps (SfMaps)
15 Jul 202624 minutes to read
NOTE
Prerequisite: Ensure that the required NuGet package is installed, the necessary namespaces are imported, and the .NET MAUI Maps control is properly configured in your application. For detailed setup and configuration instructions, refer to the Getting Started guide.
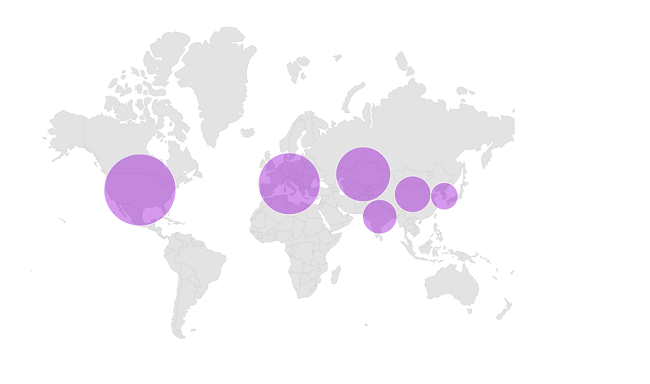
Bubbles can be rendered in different colors and sizes based on the data values of their assigned shape. You can add information to shapes such as population density, number of users, and more.
To learn more about the .NET MAUI Maps bubbles, you can check the following video.
Enable bubbles
You can enable bubbles using the ShowBubbles property. You can customize the bubbles using the BubbleSettings property, which lets you specify the values that drive the bubble size (via SizeValuePath) and the bubble color (via ColorValuePath). When both Fill and ColorValuePath are set, the ColorValuePath-based color mapping (if any) takes precedence over the static Fill.
NOTE
The XAML samples in this document bind
DataSource="{Binding Data}". Set the pageBindingContextto aViewModelinstance for the XAML binding to work, as shown in the C# samples.
<!-- code omitted for brevity -->
<map:SfMaps>
    <map:SfMaps.Layer>
        <map:MapShapeLayer ShapesSource="https://cdn.syncfusion.com/maps/map-data/world-map.json"
                           DataSource="{Binding Data}"
                           PrimaryValuePath="State"
                           ShapeDataField="name"
                           ShowBubbles="True">

            <map:MapShapeLayer.BubbleSettings>
                <map:MapBubbleSettings ColorValuePath="Population"
                                       SizeValuePath="Population"
                                       Fill="DarkViolet"
                                       MinSize="30"
                                       MaxSize="80">
                </map:MapBubbleSettings>
            </map:MapShapeLayer.BubbleSettings>
        </map:MapShapeLayer>
    </map:SfMaps.Layer>
</map:SfMaps>
public MainPage()
{
InitializeComponent();
ViewModel viewModel = new ViewModel();
this.BindingContext = viewModel;
SfMaps maps = new SfMaps();
MapShapeLayer layer = new MapShapeLayer();
layer.ShapesSource = MapSource.FromUri(new Uri("https://cdn.syncfusion.com/maps/map-data/world-map.json"));
layer.DataSource = viewModel.Data;
layer.PrimaryValuePath = "State";
layer.ShapeDataField = "name";
layer.ShowBubbles = true;
MapBubbleSettings bubbleSettings = new MapBubbleSettings()
{
ColorValuePath = "Population",
SizeValuePath = "Population",
Fill = Colors.DarkViolet,
MinSize = 30,
MaxSize = 80
};
layer.BubbleSettings = bubbleSettings;
maps.Layer = layer;
this.Content = maps;
}
public class ViewModel
{
public ObservableCollection<Model> Data { get; set; }
public ViewModel()
{
Data = new ObservableCollection<Model>();
Data.Add(new Model("India", 21));
Data.Add(new Model("United States", 58));
Data.Add(new Model("Kazakhstan", 41));
Data.Add(new Model("Italy", 48));
Data.Add(new Model("Korea", 14));
Data.Add(new Model("China", 23));
}
}
public class Model
{
public string State { get; set; }
public int Population { get; set; }
public Model(string state, int population)
{
State = state;
Population = population;
}
}
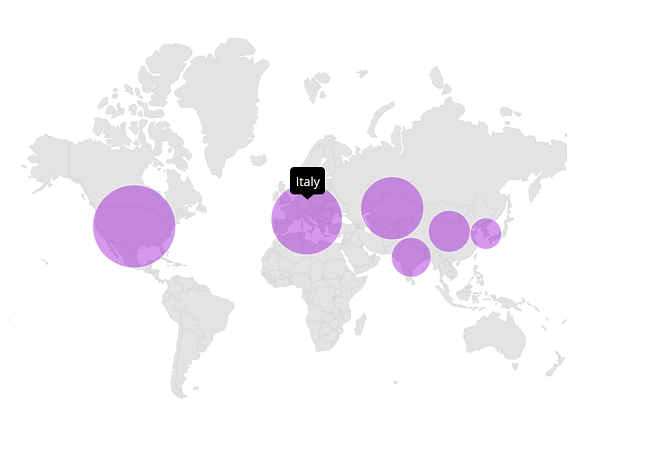
Tooltip for the bubbles
You can enable a tooltip for the bubbles using the ShowBubbleTooltip property. It can be used to clearly indicate the information about the currently interacted bubble. The following sample extends the enable-bubbles sample by adding ShowBubbleTooltip and setting the shape hover fill/stroke to Transparent so that shape hover effects do not visually interfere with the bubble tooltip.
<!-- code omitted for brevity -->
<map:SfMaps>
    <map:SfMaps.Layer>
        <map:MapShapeLayer ShapesSource="https://cdn.syncfusion.com/maps/map-data/world-map.json"
                           DataSource="{Binding Data}"
                           PrimaryValuePath="State"
                           ShapeDataField="name"
                           ShapeHoverFill="Transparent"
                           ShapeHoverStroke="Transparent"
                           ShowBubbles="True"
                           ShowBubbleTooltip="True">

            <map:MapShapeLayer.BubbleSettings>
                <map:MapBubbleSettings ColorValuePath="Population"
                                       SizeValuePath="Population"
                                       Fill="DarkViolet"
                                       MinSize="30"
                                       MaxSize="80">
                </map:MapBubbleSettings>
            </map:MapShapeLayer.BubbleSettings>
        </map:MapShapeLayer>
    </map:SfMaps.Layer>
</map:SfMaps>
public MainPage()
{
InitializeComponent();
ViewModel viewModel = new ViewModel();
this.BindingContext = viewModel;
SfMaps maps = new SfMaps();
MapShapeLayer layer = new MapShapeLayer();
layer.ShapesSource = MapSource.FromUri(new Uri("https://cdn.syncfusion.com/maps/map-data/world-map.json"));
layer.DataSource = viewModel.Data;
layer.PrimaryValuePath = "State";
layer.ShapeDataField = "name";
layer.ShapeHoverFill = Colors.Transparent;
layer.ShapeHoverStroke = Colors.Transparent;
layer.ShowBubbles = true;
layer.ShowBubbleTooltip = true;
MapBubbleSettings bubbleSettings = new MapBubbleSettings()
{
ColorValuePath = "Population",
SizeValuePath = "Population",
Fill = Colors.DarkViolet,
MinSize = 30,
MaxSize = 80
};
layer.BubbleSettings = bubbleSettings;
maps.Layer = layer;
this.Content = maps;
}
public class ViewModel
{
public ObservableCollection<Model> Data { get; set; }
public ViewModel()
{
Data = new ObservableCollection<Model>();
Data.Add(new Model("India", 21));
Data.Add(new Model("United States", 58));
Data.Add(new Model("Kazakhstan", 41));
Data.Add(new Model("Italy", 48));
Data.Add(new Model("Korea", 14));
Data.Add(new Model("China", 23));
}
}
public class Model
{
public String State { get; set; }
public int Population { get; set; }
public Model(string state, int population)
{
State = state;
Population = population;
}
}
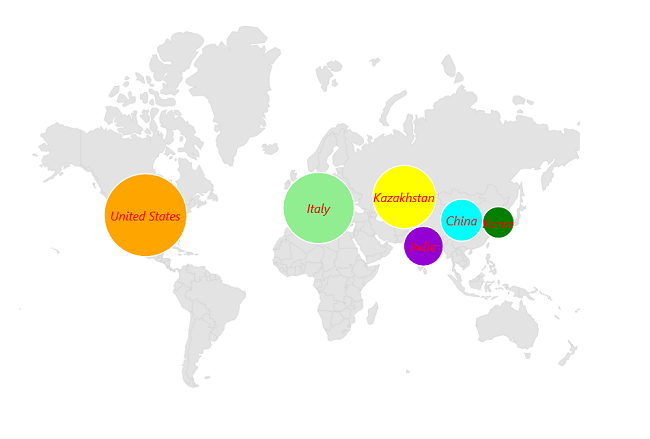
Bubble color customization
You can customize the bubble color based on the value from the ColorValuePath property. If it provides a direct color value, it applies directly to the bubbles. Otherwise, you must provide ColorMappings.
The value from the ColorValuePath will be used for the comparison in the EqualColorMapping.Value or RangeColorMapping.From and RangeColorMapping.To. Then, the RangeColorMapping.Color or EqualColorMapping.Color will be applied to the respective bubble.
NOTE
The
EqualColorMapping.Valueis compared as a string against the value resolved from theColorValuePathfield. To map a range of numeric values instead of exact matches, useRangeColorMappingwith itsFrom,To, andColorproperties.
<!-- code omitted for brevity -->
<map:SfMaps>
    <map:SfMaps.Layer>
        <map:MapShapeLayer ShapesSource="https://cdn.syncfusion.com/maps/map-data/world-map.json"
                           DataSource="{Binding Data}"
                           PrimaryValuePath="State"
                           ShapeDataField="name"
                           ShowBubbles="True">
            <map:MapShapeLayer.BubbleSettings>

            <map:MapBubbleSettings ColorValuePath="Population"
                                   SizeValuePath="Population"
                                   MinSize="30"
                                   MaxSize="80">

                    <map:MapBubbleSettings.ColorMappings>
                        <map:EqualColorMapping Color="DarkViolet" Value="21"/>
                        <map:EqualColorMapping Color="Orange" Value="58"/>
                        <map:EqualColorMapping Color="Yellow" Value="41"/>
                        <map:EqualColorMapping Color="LightGreen" Value="48"/>
                        <map:EqualColorMapping Color="Green" Value="14"/>
                        <map:EqualColorMapping Color="Aqua" Value="23"/>
                    </map:MapBubbleSettings.ColorMappings>
            </map:MapBubbleSettings>
            </map:MapShapeLayer.BubbleSettings>

        </map:MapShapeLayer>
    </map:SfMaps.Layer>
</map:SfMaps>
public MainPage()
{
InitializeComponent();
ViewModel viewModel = new ViewModel();
this.BindingContext = viewModel;
SfMaps maps = new SfMaps();
MapShapeLayer layer = new MapShapeLayer();
layer.ShapesSource = MapSource.FromUri(new Uri("https://cdn.syncfusion.com/maps/map-data/world-map.json"));
layer.DataSource = viewModel.Data;
layer.PrimaryValuePath = "State";
layer.ShapeDataField = "name";
layer.ShowBubbles = true;
MapBubbleSettings bubbleSettings = new MapBubbleSettings()
{
ColorValuePath = "Population",
SizeValuePath = "Population",
Opacity = 1,
MinSize = 30,
MaxSize = 80,
};
bubbleSettings.ColorMappings.Add(new EqualColorMapping()
{
Color = Colors.DarkViolet,
Value = "21"
});
bubbleSettings.ColorMappings.Add(new EqualColorMapping()
{
Color = Colors.Orange,
Value = "58"
});
bubbleSettings.ColorMappings.Add(new EqualColorMapping()
{
Color = Colors.Yellow,
Value = "41"
});
bubbleSettings.ColorMappings.Add(new EqualColorMapping()
{
Color = Colors.LightGreen,
Value = "48"
});
bubbleSettings.ColorMappings.Add(new EqualColorMapping()
{
Color = Colors.Green,
Value = "14"
});
bubbleSettings.ColorMappings.Add(new EqualColorMapping()
{
Color = Colors.Aqua,
Value = "23"
});
layer.BubbleSettings = bubbleSettings;
maps.Layer = layer;
this.Content = maps;
}
public class ViewModel
{
public ObservableCollection<Model> Data { get; set; }
public ViewModel()
{
Data = new ObservableCollection<Model>();
Data.Add(new Model("India", 21));
Data.Add(new Model("United States", 58));
Data.Add(new Model("Kazakhstan", 41));
Data.Add(new Model("Italy", 48));
Data.Add(new Model("Korea", 14));
Data.Add(new Model("China", 23));
}
}
public class Model
{
public String State { get; set; }
public int Population { get; set; }
public Model(string state, int population)
{
State = state;
Population = population;
}
}
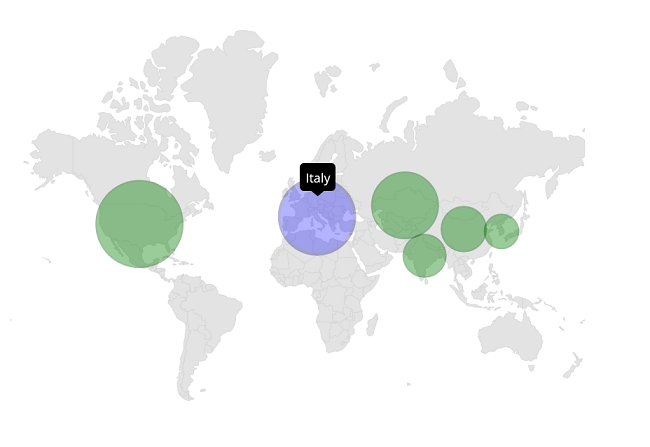
Appearance customization
You can customize the appearance of the bubbles as follows.
-
MinSize - Change the minimum radius of the bubbles using the
MinSizeproperty. The default value of theMinSizeproperty is20.0. -
MaxSize - Change the maximum radius of the bubbles using the
MaxSizeproperty. The default value of theMaxSizeproperty is50.0. -
Fill - Change the background color of the bubbles using the
Fillproperty. The default value isColor.FromArgb("#80FFFFFF"). -
Stroke - Change the stroke color of the bubbles using the
Strokeproperty. The default value isColor.FromArgb("#FFFFFF54"). -
StrokeThickness - Change the stroke width of the bubbles using the
StrokeThicknessproperty. The default value is2.0. -
HoverFill - Change the hover color of the bubbles using the
HoverFillproperty. The default value isColor.FromArgb("#9BBDDEDD"). -
HoverStroke - Change the hover stroke color of the bubbles using the
HoverStrokeproperty. The default value isColor.FromArgb("#FF80CBC4"). -
HoverStrokeThickness - Change the hover stroke thickness of the bubbles using the
HoverStrokeThicknessproperty. The default value is2.0. -
Opacity - Change the opacity of the bubbles using the
Opacityproperty. The default value is1.0.
<!-- code omitted for brevity -->
<map:SfMaps>
    <map:SfMaps.Layer>
        <map:MapShapeLayer ShapesSource="https://cdn.syncfusion.com/maps/map-data/world-map.json"
                           DataSource="{Binding Data}"
                           PrimaryValuePath="State"
                           ShapeDataField="name"
                           ShapeHoverFill = "Transparent"
                           ShapeHoverStroke="Transparent"
                           ShowBubbles="True"
                           ShowBubbleTooltip="True" >

            <map:MapShapeLayer.BubbleSettings>
                <map:MapBubbleSettings ColorValuePath="Population"
                                       SizeValuePath="Population"
                                       Fill="Green"
                                       Stroke="DarkGreen"
                                       StrokeThickness="2"
                                       HoverFill="Blue"
                                       HoverStroke="DarkBlue"
                                       HoverStrokeThickness="3"
                                       Opacity="1"
                                       MinSize="30"
                                       MaxSize="80">
                </map:MapBubbleSettings>
            </map:MapShapeLayer.BubbleSettings>
        </map:MapShapeLayer>
    </map:SfMaps.Layer>
</map:SfMaps>
public MainPage()
{
InitializeComponent();
ViewModel viewModel = new ViewModel();
this.BindingContext = viewModel;
SfMaps maps = new SfMaps();
MapShapeLayer layer = new MapShapeLayer();
layer.ShapesSource = MapSource.FromUri(new Uri("https://cdn.syncfusion.com/maps/map-data/world-map.json"));
layer.DataSource = viewModel.Data;
layer.PrimaryValuePath = "State";
layer.ShapeDataField = "name";
layer.ShapeHoverFill = Colors.Transparent;
layer.ShapeHoverStroke = Colors.Transparent;
layer.ShowBubbles = true;
layer.ShowBubbleTooltip = true;
MapBubbleSettings bubbleSettings = new MapBubbleSettings()
{
ColorValuePath = "Population",
SizeValuePath = "Population",
Fill = Colors.Green,
Stroke = Colors.DarkGreen,
StrokeThickness = 2,
HoverFill = Colors.Blue,
HoverStroke = Colors.DarkBlue,
HoverStrokeThickness = 3,
Opacity = 1,
MinSize = 30,
MaxSize = 80
};
layer.BubbleSettings = bubbleSettings;
maps.Layer = layer;
this.Content = maps;
}
public class ViewModel
{
public ObservableCollection<Model> Data { get; set; }
public ViewModel()
{
Data = new ObservableCollection<Model>();
Data.Add(new Model("India", 21));
Data.Add(new Model("United States", 58));
Data.Add(new Model("Kazakhstan", 41));
Data.Add(new Model("Italy", 48));
Data.Add(new Model("Korea", 14));
Data.Add(new Model("China", 23));
}
}
public class Model
{
public String State { get; set; }
public int Population { get; set; }
public Model(string state, int population)
{
State = state;
Population = population;
}
}
NOTE
You can refer to our .NET MAUI Maps feature tour page for its groundbreaking feature representations.
NOTE
You can also explore our .NET MAUI Maps Bubble example that shows how to configure Maps in .NET MAUI.