- Relational
- OLAP
Contact Support
Getting started
12 Jun 202313 minutes to read
Important
Starting with v16.2.0.x, if you refer to Syncfusion assemblies from trial setup or from the NuGet feed, include a license key in your projects. Refer to this link to learn about registering Syncfusion license key in your ASP.NET Core application to use our components.
Refer the getting started page of the introduction part to know more about the basic system requirements and the steps to configure the Syncfusion components in an ASP.NET Core application.
Ensure whether all the necessary dependency packages are included within the bower.json file as mentioned here, so that the required scripts and CSS to render the pivot chart control will be installed and loaded into the mentioned location (wwwroot -> lib) within your project.
Also, check whether the assembly dependency package Syncfusion.EJ.Pivot is added within the project.json file.
Now, refer to the necessary scripts and CSS files in your _Layout.cshtml page from the wwwroot -> lib -> syncfusion-javascript folder.
<html>
<head>
    <environment names="Development">
        <link rel="stylesheet" href="~/lib/bootstrap/dist/css/bootstrap.css" />
        <link rel="stylesheet" href="~/css/site.css" />
        <link href="~/lib/syncfusion-javascript/Content/ej/web/default-theme/ej.web.all.min.css" rel="stylesheet" />
        <link href="~/lib/syncfusion-javascript/Content/ej/web/responsive-css/ej.responsive.css" rel="stylesheet" />
    </environment>
</head>
<body>

    <environment names="Development">
        <script src="~/lib/jquery/dist/jquery.js"></script>
        <script src="~/lib/bootstrap/dist/js/bootstrap.js"></script>
        <script src="~/js/site.js" asp-append-version="true"></script>
        <script src="~/lib/syncfusion-javascript/Scripts/jsrender.min.js"></script>
        <script src="~/lib/syncfusion-javascript/Scripts/ej/web/ej.web.all.min.js"></script>
    </environment>

</body>
</html>
It is necessary to define the following namespace within the _viewImports.cshtml page to make use of the pivot chart control with the tag helper support.
@using Syncfusion.JavaScript
@addTagHelper "*, Syncfusion.EJ"
@addTagHelper "*, Syncfusion.EJ.Pivot"
NOTE
Script manager must be defined at the bottom of the _Layout.cshtml page.
Relational
This section covers the information required to populate a simple pivot chart with the relational data source.
Initialize pivot chart
Before initializing the pivot chart, empty the contents of Index.cshtml file under Views > Home folder and add the following codes:
<ej-pivot-chart id="PivotChart1"></ej-pivot-chart>

<style>
    #PivotChart1 {
        width:950px;
        height:460px;
    }
</style>
Populate pivot chart with data
This section illustrates how to populate the pivot chart control using a sample JSON data as shown below:
<ej-pivot-chart id="PivotChart1" load="onload"></ej-pivot-chart>

<script type="text/javascript">
function onload(args) {
    args.model.dataSource.data = [
                    { Amount: 100, Country: "Canada", Date: "FY 2005", Product: "Bike", Quantity: 2, State: "Alberta" },
                    { Amount: 200, Country: "Canada", Date: "FY 2006", Product: "Van", Quantity: 3, State: "British Columbia" },
                    { Amount: 300, Country: "Canada", Date: "FY 2007", Product: "Car", Quantity: 4, State: "Brunswick" },
                    { Amount: 150, Country: "Canada", Date: "FY 2008", Product: "Bike", Quantity: 3, State: "Manitoba" },
                    { Amount: 200, Country: "Canada", Date: "FY 2006", Product: "Car", Quantity: 4, State: "Ontario" },
                    { Amount: 100, Country: "Canada", Date: "FY 2007", Product: "Van", Quantity: 1, State: "Quebec" },
                    { Amount: 200, Country: "France", Date: "FY 2005", Product: "Bike", Quantity: 2, State: "Charente-Maritime" },
                    { Amount: 250, Country: "France", Date: "FY 2006", Product: "Van", Quantity: 4, State: "Essonne" },
                    { Amount: 300, Country: "France", Date: "FY 2007", Product: "Car", Quantity: 3, State: "Garonne (Haute)" },
                    { Amount: 150, Country: "France", Date: "FY 2008", Product: "Van", Quantity: 2, State: "Gers" },
                    { Amount: 200, Country: "Germany", Date: "FY 2006", Product: "Van", Quantity: 3, State: "Bayern" },
                    { Amount: 250, Country: "Germany", Date: "FY 2007", Product: "Car", Quantity: 3, State: "Brandenburg" },
                    { Amount: 150, Country: "Germany", Date: "FY 2008", Product: "Car", Quantity: 4, State: "Hamburg" },
                    { Amount: 200, Country: "Germany", Date: "FY 2008", Product: "Bike", Quantity: 4, State: "Hessen" },
                    { Amount: 150, Country: "Germany", Date: "FY 2007", Product: "Van", Quantity: 3, State: "Nordrhein-Westfalen" },
                    { Amount: 100, Country: "Germany", Date: "FY 2005", Product: "Bike", Quantity: 2, State: "Saarland" },
                    { Amount: 150, Country: "United Kingdom", Date: "FY 2008", Product: "Bike", Quantity: 5, State: "England" },
                    { Amount: 250, Country: "United States", Date: "FY 2007", Product: "Car", Quantity: 4, State: "Alabama" },
                    { Amount: 200, Country: "United States", Date: "FY 2005", Product: "Van", Quantity: 4, State: "California" },
                    { Amount: 100, Country: "United States", Date: "FY 2006", Product: "Bike", Quantity: 2, State: "Colorado" },
                    { Amount: 150, Country: "United States", Date: "FY 2008", Product: "Car", Quantity: 3, State: "New Mexico" },
                    { Amount: 200, Country: "United States", Date: "FY 2005", Product: "Bike", Quantity: 4, State: "New York" },
                    { Amount: 250, Country: "United States", Date: "FY 2008", Product: "Car", Quantity: 3, State: "North Carolina" },
                    { Amount: 300, Country: "United States", Date: "FY 2007", Product: "Van", Quantity: 4, State: "South Carolina" }
    ];
    loadTheme(args);
}
</script>

<style>
    #PivotChart1 {
        width:950px;
        height:460px;
    }
</style>
The JSON data is set to the “data” property present in the “e-data-source” object. The “e-data-source” object allows you to set both the data source and fields that should be displayed in the row, column, value, and filter section of the pivot chart control.
<ej-pivot-chart id="PivotChart1" load="onload">
<e-data-source>
<e-pivot-rows>
<e-row-field field-name="Country" field-caption="Country"></e-row-field>
</e-pivot-rows>
<e-pivot-columns>
<e-column-field field-name="Product" field-caption="Product"></e-column-field>
</e-pivot-columns>
<e-pivot-values>
<e-value-field field-name="Amount" field-caption="Amount"></e-value-field>
</e-pivot-values>
</e-data-source>
<e-common-series-options type="Column" enable-animation="true">
<e-chart-tooltip visible="true"></e-chart-tooltip>
</e-common-series-options>
<e-size width="950px" height="460px"></e-size>
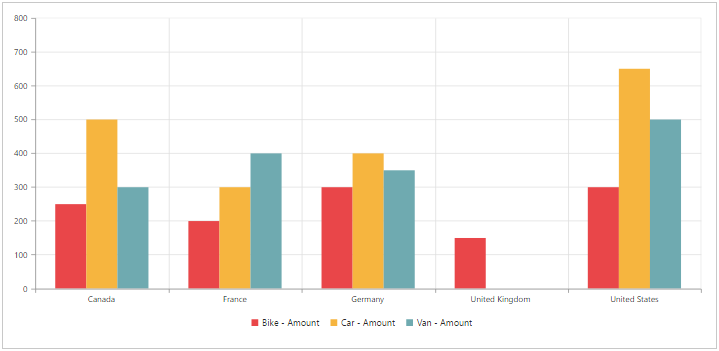
<e-legend row-count="2"></e-legend>
</ej-pivot-chart>The above code will generate a simple pivot chart with sales amount over products in different regions.
OLAP
This section covers the information required to populate a simple pivot chart with OLAP data source.
Initialize pivot chart
Before initializing the pivot chart, empty the contents of Index.cshtml file under Views > Home folder and add the following codes:
<ej-pivot-chart id="PivotChart1"></ej-pivot-chart>

<style>
    #PivotChart1 {
        width:950px;
        height:460px;
    }
</style>
Populate pivot chart with data source
Initializes the OLAP data source for the pivot chart control as shown below:
<ej-pivot-chart id="PivotChart1">
<e-data-source catalog="Adventure Works DW 2008 SE" cube="Adventure Works" data="//bi.syncfusion.com/olap/msmdpump.dll">
<e-pivot-rows>
<e-row-field field-name="[Date].[Fiscal]"></e-row-field>
</e-pivot-rows>
<e-pivot-columns>
<e-column-field field-name="[Customer].[Customer Geography]"></e-column-field>
</e-pivot-columns>
<e-pivot-values>
<e-value-field axis="Column">
<e-measures>
<e-measure-items field-name="[Measures].[Internet Sales Amount]"></e-measure-items>
</e-measures>
</e-value-field>
</e-pivot-values>
</e-data-source>
<e-common-series-options type="Column" enable-animation="true">
<e-chart-tooltip visible="true"></e-chart-tooltip>
</e-common-series-options>
<e-size width="950px" height="460px"></e-size>
<e-legend row-count="2"></e-legend>
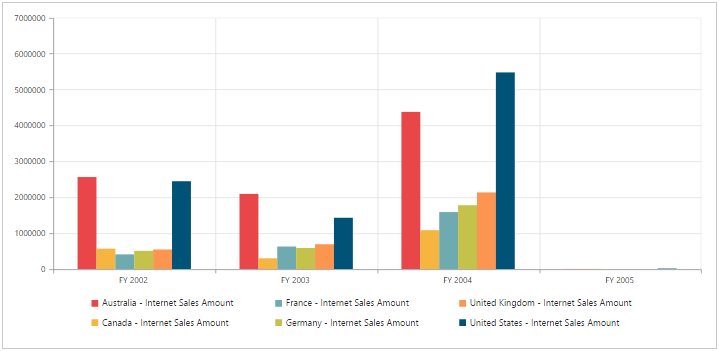
</ej-pivot-chart>The above code will generate a simple pivot chart with internet sales amount over a period of fiscal years across different customer geographic locations.