Legend in WPF Olap Chart
6 Jan 20254 minutes to read
Legends are used to display the name of data series. The chart legend can be added to an OLAP chart by adding the chart legend of the chart WPF, which is found under the Syncfusion.Windows.Chart namespace. The following code sample explains how to add a legend to an OLAP chart.
<syncfusion:OlapChart.Legend>
     <syncfusion:ChartLegend Background="Transparent"/>
</syncfusion:OlapChart.Legend>this.olapChart.Legend = new ChartLegend();Me.olapChart.Legend = New ChartLegend()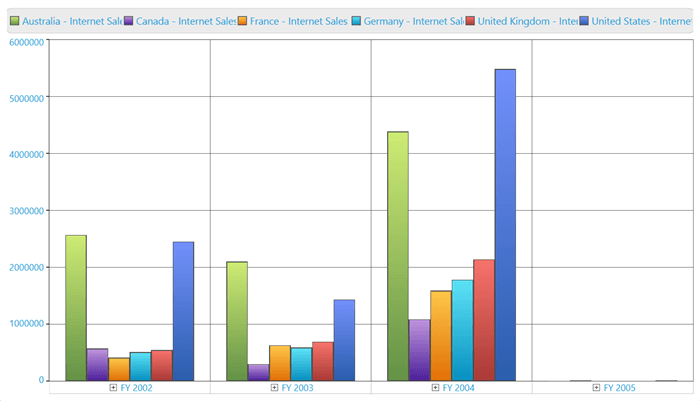
Show/hide legend
The chart legend has a Visibility property using which you can show or hide the chart legend in the OLAP chart. The following code sample shows how you can collapse the visibility of the chart legend.
<syncfusion:OlapChart.Legend>
     <syncfusion:ChartLegend Visibility="Collapsed" />
</syncfusion:OlapChart.Legend>this.olapChart.Legend.Visibility = System.Windows.Visibility.Collapsed;Me.olapChart.Legend.Visibility = System.Windows.Visibility.Collapsed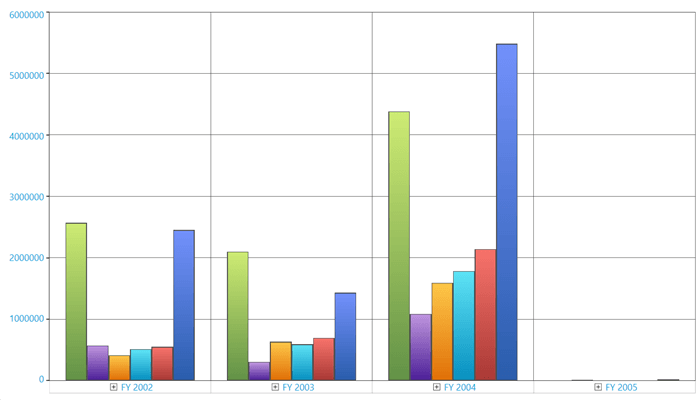
Visibility customization
The visibility of the legend check box can be toggled by using the CheckBoxVisibility property in the chart legend. The following code sample shows how to toggle the visibility of check box in the legend of the OLAP chart.
<syncfusion:OlapChart.Legend>
     <syncfusion:ChartLegend CheckBoxVisibility="Collapsed" />
</syncfusion:OlapChart.Legend>this.olapChart.Legend.CheckBoxVisibility = System.Windows.Visibility.Collapsed;Me.olapChart.Legend.CheckBoxVisibility = System.Windows.Visibility.CollapsedThe visibility of the legend icon can be toggled by using the IconVisibility property in the chart legend. The following code sample shows how to toggle the visibility of icons in the OLAP chart legend.
<syncfusion:OlapChart.Legend>
     <syncfusion:ChartLegend IconVisibility="Collapsed" />
</syncfusion:OlapChart.Legend>this.olapChart.Legend.IconVisibility = System.Windows.Visibility.Collapsed;Me.olapChart.Legend.IconVisibility = System.Windows.Visibility.CollapsedDock position
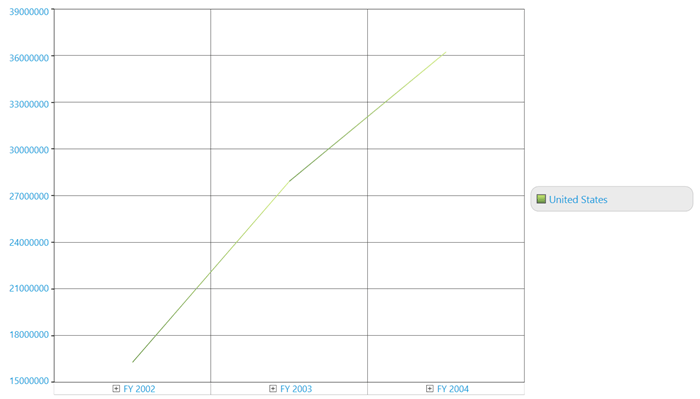
The chart legend contains an enum property called ChartDock, which has the following values Floating, Right, Left, Top, and Bottom. You can choose the required docking position to dock the legend. The following code sample explains how to set the docking position for the OLAP chart legend.
ChartDockPanel.SetDock(this.olapChart.Legend, ChartDock.Right);ChartDockPanel.SetDock(Me.olapChart.Legend, ChartDock.Right)Row/column setting
You can use the RowsCount and ColumnsCount property to create the rows or columns of the OLAP chart legend. The RowsCount and ColumnsCount will be used internally to create a grid layout control to place the legends. The following code sample shows how to set the number of rows or columns in an legend.
<syncfusion:OlapChart.Legend>
     <syncfusion:ChartLegend Background="Transparent"
          RowsCount="2" ColumnsCount="2" />
</syncfusion:OlapChart.Legend>this.olapChart.Legend.RowsCount = 2;
this.olapChart.Legend.ColumnsCount = 2;Me.olapChart.Legend.RowsCount = 2
Me.olapChart.Legend.ColumnsCount = 2NOTE
The RowsCount and ColumnsCount are used to create the rows and columns in the grid layout control, which is used to place the legends. If you give extra row or column count than the legend availability, it will display empty spaces to fill the structure of the grid. The following illustration explains this in detail.
The following chart has only one legend, but the RowsCount and ColumnsCount are set as 2. Therefore, the resultant legend will appear as follows:
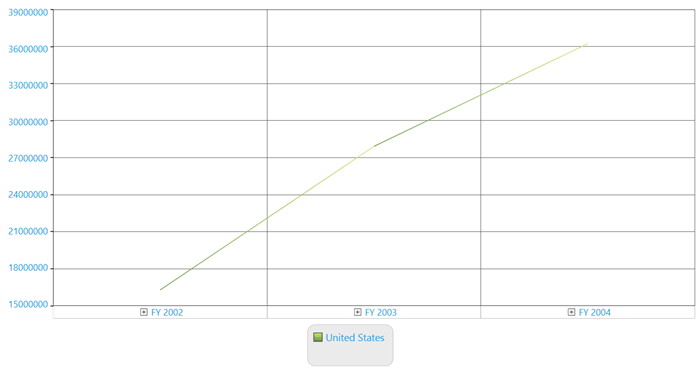
Legend with RowsCount=2, ColumnsCount=2 and ChartDock.Top
Legend with RowsCount=2, ColumnsCount=2 and ChartDock.Right
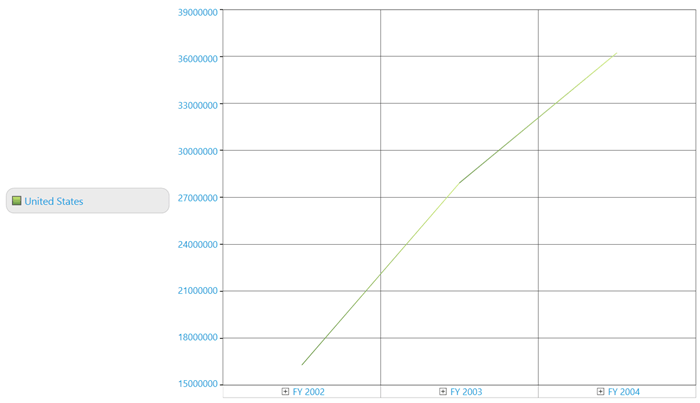
Legend with RowsCount=2, ColumnsCount=2 and ChartDock.Left
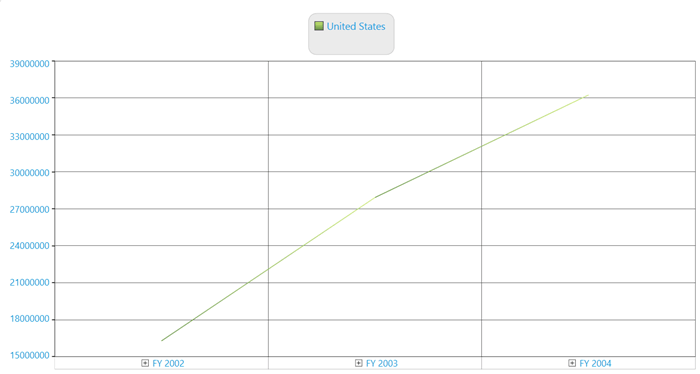
Legend with RowsCount=2, ColumnsCount=2 and ChartDock.Bottom