How can I help you?
Area in WPF Olap Chart
6 Jan 20253 minutes to read
The OLAP area is a chart area, which contains the chart series and chart axes.
Adding chart header
The chart header is the title of the chart, which is usually displayed at the top center of the chart area. The following illustration displays the chart header displayed in the chart area.
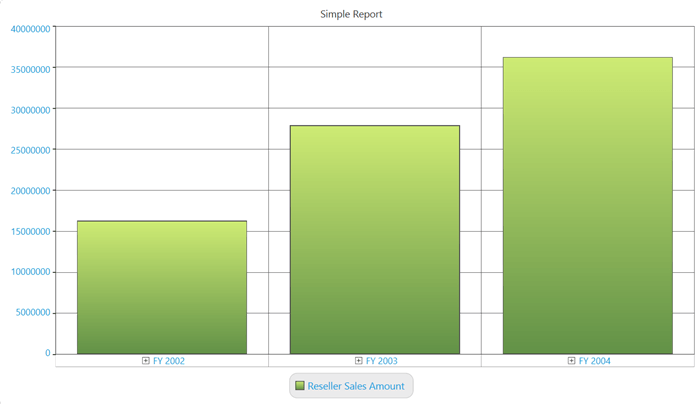
In general, chart series contains a chart area instance, which can be used to customize the OLAP area. The following code sample describes how to add a chart header to an OLAP chart.
this.olapchart1.Series[0].Area.Header = "Simple Report";Me.olapchart1.Series(0).Area.Header = "Simple Report"NOTE
The series will be available only after data is bound to the control. In other words, you can access the series property of the OLAP chart only after the call to DataBind() is made.
Area customization
An OLAp area is basically derived from the ChartArea class belonging to the base chart WPF control. So, the customization options are available in the chart area. However, 3D charts and multiple chart areas are not supported in an OLAP chart. So, those customizations are not applicable.
The following are the frequently used customization options that are available in the chart area.
- Background
- GridBackground
- Foreground
- FontFamily
- FontSize
- FontStyle
- FontWeight
- BorderBrush
- BorderThickness
- CornerRadius
The OLAP area allows you to customize the border properties. The following code sample explains how these properties can be customized.
BorderBrush
this.olapChart.Series[0].Area.BorderBrush = Brushes.Black;Me.olapChart.Series(0).Area.BorderBrush = Brushes.BlackBorderThickness
this.olapChart.Series[0].Area.BorderThickness = new Thickness(2);Me.olapChart.Series(0).Area.BorderThickness = New Thickness(2)CornerRadius
this.olapChart.Series[0].Area.CornerRadius = new CornerRadius(5);Me.olapChart.Series(0).Area.CornerRadius = New CornerRadius(5)Background
this.olapChart.Series[0].Area.Background = Brushes.SkyBlue;Me.olapChart.Series(0).Area.Background = Brushes.SkyBlueGridBackground
this.olapChart.Series[0].Area.GridBackground = Brushes.LightBlue;Me.olapChart.Series(0).Area.GridBackground = Brushes.LightBlueFontStyle
this.olapChart.Series[0].Area.FontStyle = FontStyles.Italic;Me.olapChart.Series(0).Area.FontStyle = FontStyles.Italic