How can I help you?
Selection in WinUI Chart (SfFunnelChart)
19 May 20267 minutes to read
The funnel chart supports selection that allows the selection of a segment in the chart by using the SelectionBehavior.
Properties
The Selection feature can be configured using the following properties:
-
Type - Gets or Sets the ChartSelectionType Enum value for the Selection Behavior.
The following ChartSelectionType can be achieved during Selection:- Single - Allows to select a single segment.
- SingleDeselect - Allows to select and deselect a single segment.
- Multiple - Allows to select multiple segments.
- None - Restricts the segment selection.
- SelectionBrush - Gets or Sets the SelectionBrush color value for Selection Behavior.
- SelectedIndex - Gets or Sets the index value of the segment that should be selected during the Selection.
- SelectedIndexes - Gets or Sets the list of indexes of the segments that should be selected during the Selection.
Enable Selection
To enable the selection in the chart, create an instance of the DataPointSelectionBehavior and set it to the SelectionBehavior of funnel the chart. Also, set the SelectionBrush property to highlight the segment in the funnel chart.
<chart:SfFunnelChart
    x:Name="chart"
    Height="388"
    Width="500"
    ItemsSource="{Binding Data}"
    XBindingPath="Category"
    YBindingPath="Value">
    <chart:SfFunnelChart.SelectionBehavior>
        <chart:DataPointSelectionBehavior SelectionBrush="Red"/>
    </chart:SfFunnelChart.SelectionBehavior>
</chart:SfFunnelChart>
SfFunnelChart chart = new SfFunnelChart();
chart.SetBinding(SfFunnelChart.ItemsSourceProperty, new Binding()
{
Path = new PropertyPath("Data")
});
chart.XBindingPath = "Category";
chart.YBindingPath = "Value";
DataPointSelectionBehavior selection = new DataPointSelectionBehavior()
{
SelectionBrush = new SolidColorBrush(Colors.Red),
};
chart.SelectionBehavior = selection;
. . .
this.Content = chart;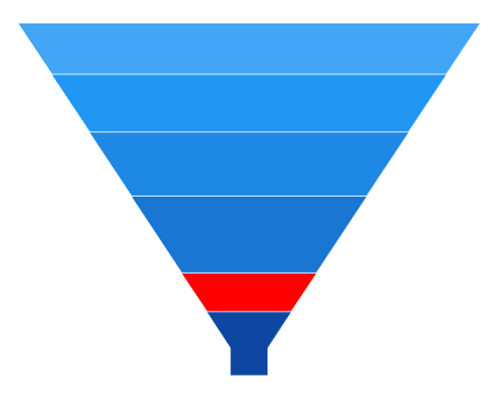
Multi-selection
The funnel chart provides support to select multiple segments by using the Type property as Multiple. By default, the value of the Type is Single and it is used for a single selection.
NOTE
The
SeriesandMultiSeriesselection types are not supported for the funnel chart
<chart:SfFunnelChart
    x:Name="chart"
    ItemsSource="{Binding Data}"
    XBindingPath="Category"
    YBindingPath="Value">
    <chart:SfFunnelChart.SelectionBehavior>
        <chart:DataPointSelectionBehavior SelectionBrush="Red" Type="Multiple"/>
    </chart:SfFunnelChart.SelectionBehavior>
    . . .
</chart:SfFunnelChart>
SfFunnelChart chart = new SfFunnelChart();
chart.SetBinding(SfFunnelChart.ItemsSourceProperty, new Binding()
{
Path = new PropertyPath("Data")
});
chart.XBindingPath = "Category";
chart.YBindingPath = "Value";
DataPointSelectionBehavior selection = new DataPointSelectionBehavior()
{
SelectionBrush = new SolidColorBrush(Colors.Red),
Type = ChartSelectionType.Multiple,
};
chart.SelectionBehavior = selection;
. . .
this.Content = chart;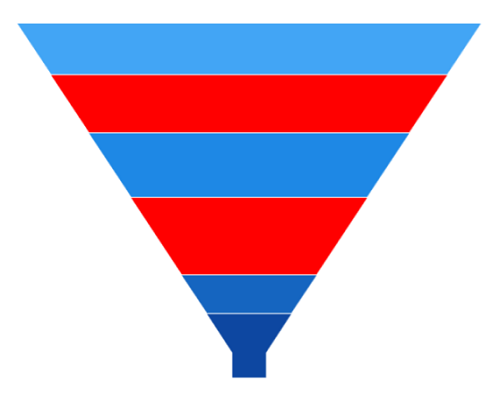
Selection on initial rendering
SelectedIndex
The funnel chart provides support to select a point programmatically on a chart using the the SelectedIndex property of the DataPointSelectionBehavior.
<chart:SfFunnelChart
    x:Name="chart"
    Height="388"
    Width="500"
    ItemsSource="{Binding Data}"
    XBindingPath="Category"
    YBindingPath="Value">
    <chart:SfFunnelChart.SelectionBehavior>
        <chart:DataPointSelectionBehavior SelectionBrush="Red" SelectedIndex="2"/>
    </chart:SfFunnelChart.SelectionBehavior>
</chart:SfFunnelChart>
SfFunnelChart chart = new SfFunnelChart();
chart.SetBinding(SfFunnelChart.ItemsSourceProperty, new Binding()
{
Path = new PropertyPath("Data")
});
chart.XBindingPath = "Category";
chart.YBindingPath = "Value";
DataPointSelectionBehavior selection = new DataPointSelectionBehavior()
{
SelectionBrush = new SolidColorBrush(Colors.Red),
SelectedIndex= 2
};
chart.SelectionBehavior = selection;
. . .
this.Content = chart;
SelectedIndexes
Funnel chart provides support to select multiple points programmatically on a chart using the SelectedIndexes property of DataPointSelectionBehavior.
<chart:SfFunnelChart
    x:Name="chart"
    ItemsSource="{Binding Data}"
    XBindingPath="Category"
    YBindingPath="Value">
    <chart:SfFunnelChart.SelectionBehavior>
        <chart:DataPointSelectionBehavior
            SelectionBrush="Red"
            Type="Multiple"
            SelectedIndexes="{Binding SelectedIndexes}"/>
    </chart:SfFunnelChart.SelectionBehavior>
    . . .
</chart:SfFunnelChart>
SfFunnelChart chart = new SfFunnelChart();
chart.SetBinding(SfFunnelChart.ItemsSourceProperty, new Binding()
{
Path = new PropertyPath("Data")
});
chart.XBindingPath = "Category";
chart.YBindingPath = "Value";
DataPointSelectionBehavior selection = new DataPointSelectionBehavior()
{
SelectionBrush = new SolidColorBrush(Colors.Red),
Type = ChartSelectionType.Multiple,
SelectedIndexes = new List<int>() { 2, 3, 4 }
};
chart.SelectionBehavior = selection;
. . .
this.Content = chart;
Events
The following selection events are available in the ChartSelectionBehavior.
SelectionChanging
The SelectionChanging event occurs before the data point is being selected. This is a cancelable event. The ChartSelectionChangingEventArgs contains the following information.
- NewIndexes - Gets the collection of selected data point index. Here, NewIndexes[0] is the current selected index.
- OldIndexes - Gets the collection of previous selected data point index. Here, OldIndexes[0] is the current unselected index.
- Cancel - Gets or sets a value that indicates whether the selection should be canceled.
SelectionChanged
The SelectionChanged event occurs after a data point has been selected. The ChartSelectionChangedEventArgs contains the following information.
- NewIndexes - Gets the collection of selected data point index. Here, NewIndexes[0] is the current selected index.
- OldIndexes - Gets the collection of previous selected data point index. Here, OldIndexes[0] is the current unselected index.