How can I help you?
Spreadsheet Sparkline Chart
Sparkline are easy to interpret and it conveys much more information to the user by visualizing the data in a small amount of space. Here sparkline were placed inside the cell. It creates the Sparkline based on the selected cell range’s data. You can use allowSparkline property to enable/disable Sparkline.
Types of Sparkline
The Following Types of Sparkline are available in Spreadsheet.
- Column
- Line
- Win/loss
You can create the Sparkline by one of the following ways,
- Using the
Sparkline Typebutton to select the type of Sparkline under Sparkline groups of INSERT Tab in ribbon. - Using
createSparklinemethod to create the Sparkline.
Sparkline Customization
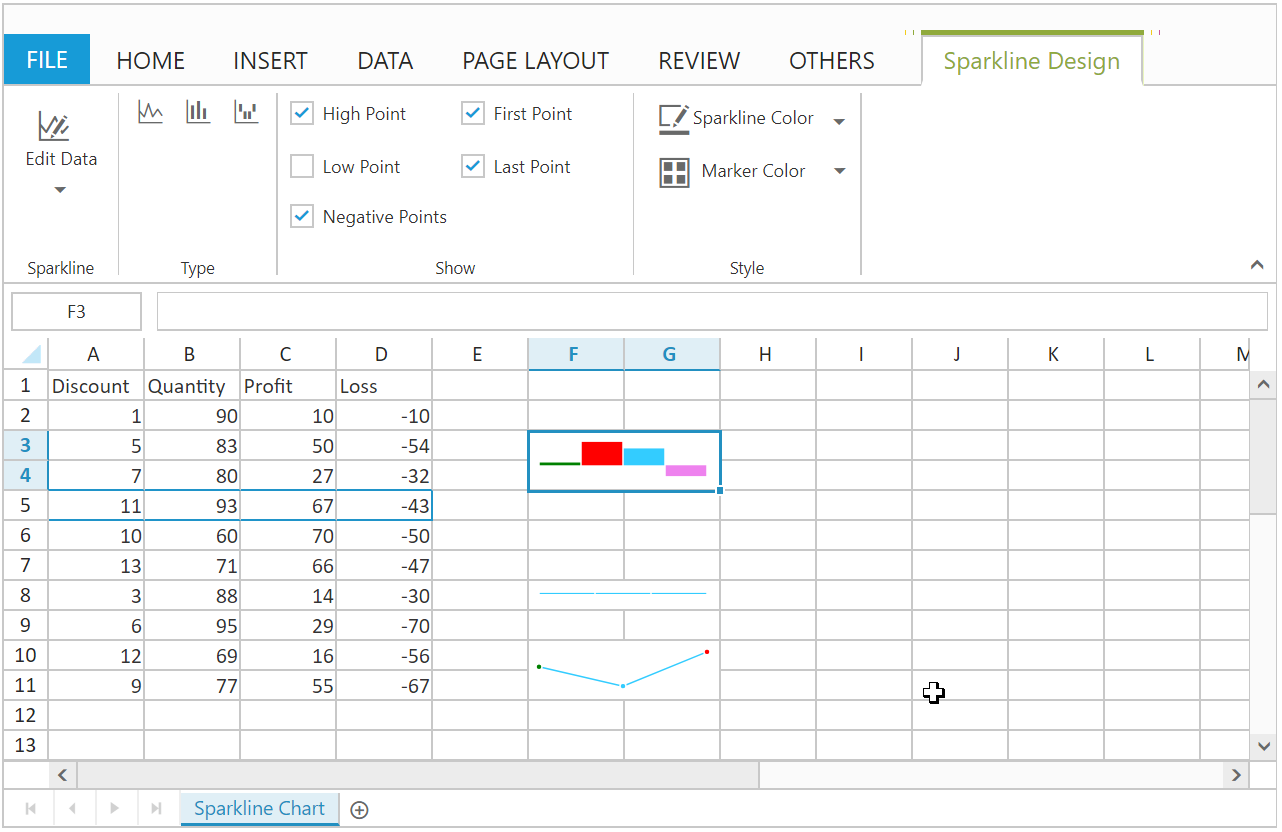
You can perform the following customizations for Sparkline. These options are available in SPARKLINE DESIGN Tab which is enabled, while clicking the Sparkline element.
| Feature | API | Description |
|---|---|---|
| Edit Data & Location Range | You can modify the data range, location range of Sparkline | |
| Sparkline Type | You can change the type of sparkline by using sparkline type button. | |
| High Point, First Point, Last Point, Low Point, Negative Point, Sparkline Color and Marker Color | You can high light the high point, low point, first point, last point, negative point and Marker Color of sparkline . |
The following code example describes the above behavior,
<div id="Spreadsheet"></div>

<script>

$(function () {
        $("#Spreadsheet").ejSpreadsheet({
            // the datasource "window.sparklineList" is referred from 'http://js.syncfusion.com/demos/web/scripts/xljsondata.js'
            allowSparkline: true,
            sheets: [
                { rangeSettings: [{ dataSource: window.sparklineList, startCell: "A1" }], sheetName: "Sparkline Chart"},
            ],
            loadComplete: "loadComplete"
        });
    });

   function loadComplete() {
        var  xlSparkline = this.XLSparkline;
        if(!this.isImport) {
           this.mergeCells("F3:G4", true);
           xlSparkline.createSparkline("A5:D5", "F3", "Column", {highPointColor: "red", negativePointColor: "black", startPointColor: "green"} );
           this.mergeCells("F8:G8", true);
           xlSparkline.createSparkline("B2:B4", "F8", "Winloss");
           this.mergeCells("F10:G11", true);
           xlSparkline.createSparkline("C3:C5", "F10",  "Line", {markerSettings:{visible:true},highPointColor: "red", negativePointColor: "black", startPointColor: "green"} );

        }
    }

</script>
The following output is displayed as a result of the above code example.