Plot band in Flutter Spark Charts
23 May 20251 minute to read
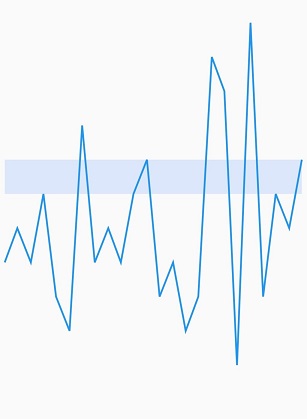
This feature is used to highlight a particular region in the spark charts along the Y axis.
The following properties are used to customize the appearances:
-
start- used to configure the start plot band value in Y axis. -
end- used to configure the end plot band values in Y axis. -
color- used to change the color for plot band. -
borderColor- used to change the border color of plot band. -
borderWidth- used to change the border width of plot band.
@override
    Widget build(BuildContext context) {
      return Scaffold(
        body: Center(
          child: SfSparkLineChart(
            axisLineWidth:0,
              plotBand: SparkChartPlotBand(start: 7, end: 8),
              data: <double>[
                  5, 6, 5, 7, 4, 3, 9, 5, 6, 5, 7, 8, 4, 5, 3, 4, 11, 10, 2, 12, 4, 7, 6, 8
              ],
          )
        )
      );
    }