Marker and data label in Flutter Spark Charts
23 May 20255 minutes to read
Marker
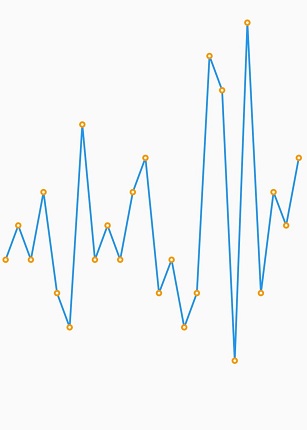
Markers are used to provide information about the exact point location. You can add a shape to adorn each data point. Using the marker property, add markers to SfSparkLineChart, and SfSparkAreaChart widgets.
You can use the following properties to customize the appearance:
-
displayMode- Toggles the visibility of the marker. Defaults toSparkChartMarkerDisplayMode.none. -
borderWidth- Represents the border width of the marker. -
color- Represents the color of the marker. -
borderColor- Represents the border color of the marker.
@override
    Widget build(BuildContext context) {
      return Scaffold(
        body: Center(
          child: SfSparkLineChart(
            axisLineWidth: 0,
              marker: SparkChartMarker(
                borderColor: Colors.orange,
                borderWidth: 2,
                displayMode: SparkChartMarkerDisplayMode.all
              ),
              data: <double>[
                    5, 6, 5, 7, 4, 3, 9, 5, 6, 5, 7, 8, 4, 5, 3, 4, 11, 10, 2, 12, 4, 7, 6, 8
              ],
          )
        )
      );
    }
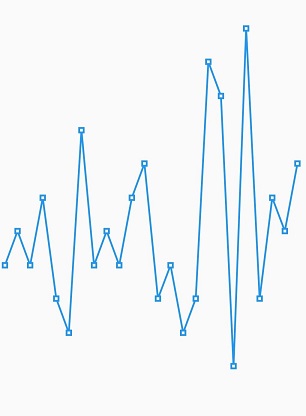
Customizing marker shapes
Markers can be assigned with different shapes using the shape property. By default, markers are rendered with circle shape. The shapes of markers are listed below.
- circle,
- diamond,
- square,
- triangle,
- invertedTriangle
@override
    Widget build(BuildContext context) {
      return Scaffold(
        body: Center(
          child: SfSparkLineChart(
            axisLineWidth: 0,
            marker: SparkChartMarker(
              shape: SparkChartMarkerShape.square,
              displayMode: SparkChartMarkerDisplayMode.all
            ),
            data: <double>[
              5, 6, 5, 7, 4, 3, 9, 5, 6, 5, 7, 8, 4, 5, 3, 4, 11, 10, 2, 12, 4, 7, 6, 8
            ],
          )
        )
      );
    }
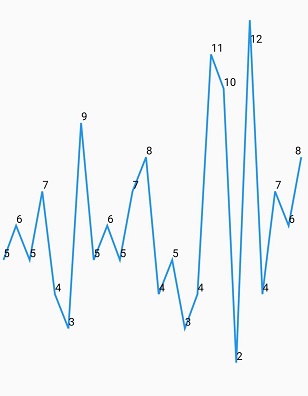
Data label
Data labels are used to display values of data points to improve the readability.
Enable data label
To enable data label for spark charts, use the labelDisplayMode property in spark charts widgets.
Following possible values are available in spark charts to render data label:
-
SparkChartLabelDisplayMode.none- Does not allow to display data points on any side. -
SparkChartLabelDisplayMode.all- Allows to display data labels on all points. -
SparkChartLabelDisplayMode.high- Allows to display data labels on the high point. -
SparkChartLabelDisplayMode.low- Allows to display data labels on the low point. -
SparkChartLabelDisplayMode.last- Allows to display data labels on the last point. -
SparkChartLabelDisplayMode.first- Allows to display data labels on the first point.
@override
    Widget build(BuildContext context) {
      return Scaffold(
        body: Center(
          child: SfSparkLineChart(
              axisLineWidth: 0,
              labelDisplayMode: SparkChartLabelDisplayMode.all,
              data: <double>[
                  5, 6, 5, 7, 4, 3, 9, 5, 6, 5, 7, 8, 4, 5, 3, 4, 11, 10, 2, 12, 4, 7, 6, 8
              ],
          )
        )
      );
    }
NOTE
The
SfSparkWinLossChartwidget doesn’t provide data label support.