Axis types in Flutter Spark Charts
29 Mar 202212 minutes to read
Charts typically have two axes that are used to measure and categorize data: a vertical (Y) axis, and a horizontal (X) axis.
Vertical(Y) axis always uses numerical scale. Horizontal(X) axis supports the following types of scale:
- Category
- Numeric
- Date-time
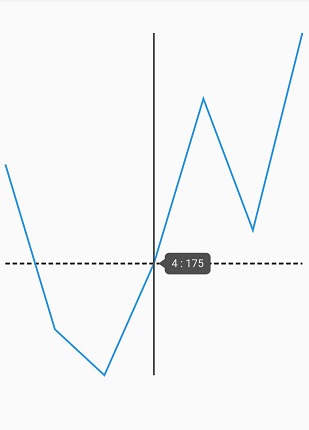
Numeric axis
To use the numeric values or to bind the custom data source use the SfSparkBarChart.custom() method and map the x, y values to xValueMapper and yValueMapper respectively. Here you have to specify the length of the data using dataCount property.
@override
    Widget build(BuildContext context) {
      return Scaffold(
        body: Padding(
          padding: EdgeInsets.all(5),
          child: SfSparkBarChart.custom(
            axisLineWidth: 0,
            dataCount: 7,
            xValueMapper: (index) => data[index].xval,
            yValueMapper: (index) => data[index].yval,
          )
        ),
      );
    }

    final List<ChartData> data = [
      ChartData(xval: 1, yval: 190),
      ChartData(xval: 2, yval: 165),
      ChartData(xval: 3, yval: 158),
      ChartData(xval: 4, yval: 175),
      ChartData(xval: 5, yval: 200),
      ChartData(xval: 6, yval: 180),
      ChartData(xval: 7, yval: 210),
    ];

    class ChartData {
      ChartData({this.xval, this.yval});
      final double xval;
      final double yval;
    }
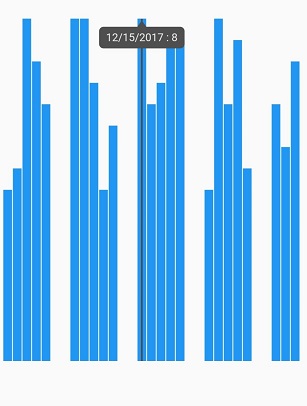
Date-time axis
To use the date-time values i.e to bind the custom data source use the SfSparkBarChart.custom() method and map the x, y values to xValueMapper and yValueMapper respectively. Here you have to specify the length of the data using dataCount property.
@override
    Widget build(BuildContext context) {
      return Scaffold(
        body: Padding(
          padding: EdgeInsets.all(5),
          child: SfSparkBarChart.custom(
            axisLineWidth: 0,
            dataCount: 23,
            xValueMapper: (index) => data[index].xval,
            yValueMapper: (index) => data[index].yval,
          )
        ),
      );
    }
    final List<ChartData> data = [
      ChartData(xval: DateTime(2018, 0, 1), yval: 4),
      ChartData(xval: DateTime(2018, 0, 2), yval: 4.5),
      ChartData(xval: DateTime(2018, 0, 3), yval: 8),
      ChartData(xval: DateTime(2018, 0, 4), yval: 7),
      ChartData(xval: DateTime(2018, 0, 5), yval: 6),
      ChartData(xval: DateTime(2018, 0, 8), yval: 8),
      ChartData(xval: DateTime(2018, 0, 9), yval: 8),
      ChartData(xval: DateTime(2018, 0, 10), yval: 6.5),
      ChartData(xval: DateTime(2018, 0, 11), yval: 4),
      ChartData(xval: DateTime(2018, 0, 12), yval: 5.5),
      ChartData(xval: DateTime(2018, 0, 15), yval: 8),
      ChartData(xval: DateTime(2018, 0, 16), yval: 6),
      ChartData(xval: DateTime(2018, 0, 17), yval: 6.5),
      ChartData(xval: DateTime(2018, 0, 18), yval: 7.5),
      ChartData(xval: DateTime(2018, 0, 19), yval: 7.5),
      ChartData(xval: DateTime(2018, 0, 22), yval: 4),
      ChartData(xval: DateTime(2018, 0, 23), yval: 8),
      ChartData(xval: DateTime(2018, 0, 24), yval: 6),
      ChartData(xval: DateTime(2018, 0, 25), yval: 7.5),
      ChartData(xval: DateTime(2018, 0, 26), yval: 4.5),
      ChartData(xval: DateTime(2018, 0, 29), yval: 6),
      ChartData(xval: DateTime(2018, 0, 30), yval: 5),
      ChartData(xval: DateTime(2018, 0, 31), yval: 7),
    ];

    class ChartData {
      ChartData({this.xval, this.yval});
      final DateTime xval;
      final double yval;
    }
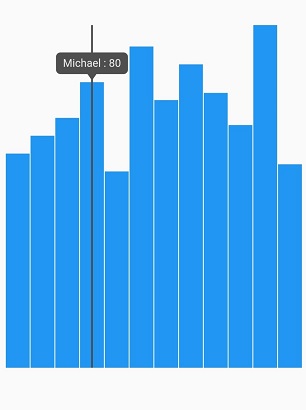
Category Axis
To use the category values i.e to bind the custom data source use the SfSparkBarChart.custom() method and map the x, y values to xValueMapper and yValueMapper respectively. Here you have to specify the length of the data using dataCount property.
@override
    Widget build(BuildContext context) {
      return Scaffold(
        body: Padding(
          padding: EdgeInsets.all(5),
          child: SfSparkLineChart.custom(
            axisLineWidth: 0,
            dataCount: 12,
            xValueMapper: (index) => data[index].xval,
            yValueMapper: (index) => data[index].yval,
          )
        ),
      );
    }
    final List<ChartData> data = [
      ChartData(xval: 'Robert', yval: 60),
      ChartData(xval: 'Andrew', yval: 65),
      ChartData(xval: 'Suyama', yval: 70),
      ChartData(xval: 'Michael', yval: 80),
      ChartData(xval: 'Janet', yval: 55),
      ChartData(xval: 'Davolio', yval: 90),
      ChartData(xval: 'Fuller', yval: 75),
      ChartData(xval: 'Nancy', yval: 85),
      ChartData(xval: 'Margaret', yval: 77),
      ChartData(xval: 'Steven', yval: 68),
      ChartData(xval: 'Laura', yval: 96),
      ChartData(xval: 'Elizabeth', yval: 57)
    ];

    class ChartData {
      ChartData({this.xval, this.yval});
      final String xval;
      final double yval;
    }
Axis line customization
Axis line of the spark charts can be customized using the following properties.
-
axisCrossesAt- Specifies the horizontal axis line position. The default value is0. -
axisLineColor- Specifies the color of the axis line. -
axisLineWidth- Specifies the width of the axis line. -
axisLineDashArray- Specifies the axis line dash array.
@override
    Widget build(BuildContext context) {
      return Scaffold(
        body: Padding(
          padding: EdgeInsets.all(5),
          child: SfSparkLineChart.custom(
            axisLineWidth: 2,
            axisLineDashArray: <double>[5,3],
            axisCrossesAt: 174,
            dataCount: 7,
            xValueMapper: (index) => data[index].xval,
            yValueMapper: (index) => data[index].yval,
          )
        ),
      );
    }

    final List<ChartData> data = [
      ChartData(xval: 1, yval: 190),
      ChartData(xval: 2, yval: 165),
      ChartData(xval: 3, yval: 158),
      ChartData(xval: 4, yval: 175),
      ChartData(xval: 5, yval: 200),
      ChartData(xval: 6, yval: 180),
      ChartData(xval: 7, yval: 210),
    ];