How can I help you?
Appearance customization in Flutter Funnel Chart (SfFunnelChart)
7 Aug 20256 minutes to read
Chart sizing
Chart renders based on the parent widget size. If you need the chart to be rendered in specific size, then set the size(width/height) to the parent widget.
@override
    Widget build(BuildContext context) {
        return Scaffold(
          body: SafeArea(
            child: Center(
            child: Container(
              height: 300,
              width: 350,
              child: SfFunnelChart()
            )
           )
          )
        );
    }
Chart margin
Margin to the chart can be specified using the margin property.
@override
      Widget build(BuildContext context) {
        List<ChartData> chartData = [
          ChartData('Jan', 35),
          ChartData('Feb', 28),
          ChartData('Mar', 38),
          ChartData('Apr', 32),
          ChartData('May', 40)
        ];
        return Scaffold(
          body: SafeArea(
            child: Center(
              child: Container(
                height: 300,
                width: 350,
                child: SfFunnelChart(
                  borderColor: Colors.red,
                  borderWidth: 2,
                  // Sets 15 logical pixels as margin for all the 4 sides.
                  margin: EdgeInsets.all(15),
                  series: FunnelSeries<ChartData, String>(
                    dataSource: chartData,
                    xValueMapper: (ChartData data, _) => data.x,
                    yValueMapper: (ChartData data, _) => data.y,
                  )
                )
              )
            )
          )
        );
      }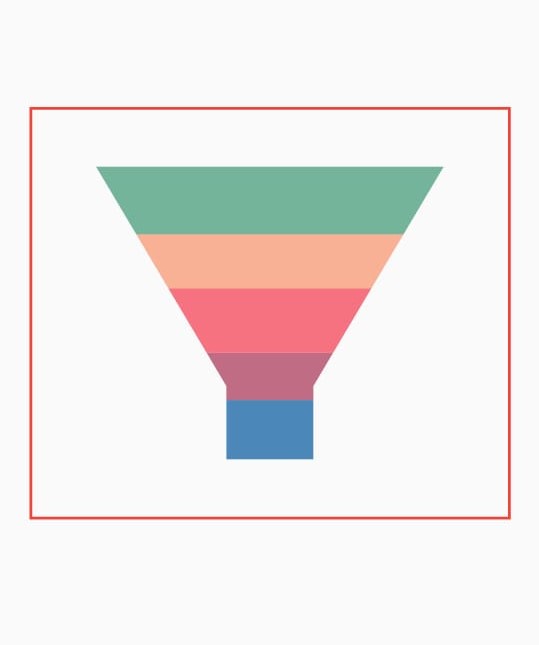
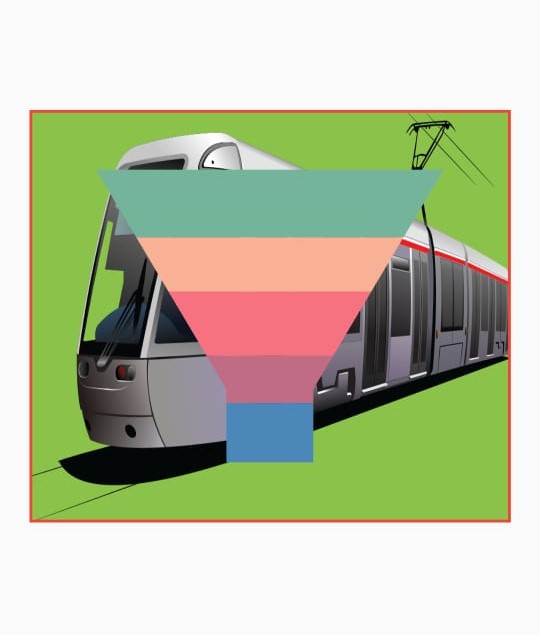
Chart area customization
You can customize the area of the chart using the below properties.
-
backgroundColor- used to change the chart area background color. -
backgroundImage- used to set the image path.
@override
    Widget build(BuildContext context) {
      return Scaffold(
        body: SafeArea(
          child: Center(
            child: Container(
              height: 300,
              width: 350,
              child: SfFunnelChart(
                borderColor: Colors.red,
                borderWidth: 2,
                margin: EdgeInsets.all(15),
                backgroundColor: Colors.lightGreen,
                backgroundImage: const AssetImage('images/train.png'),
                series: FunnelSeries<ChartData, String>(
                dataSource: chartData,
                xValueMapper: (ChartData data, _) => data.x,
                yValueMapper: (ChartData data, _) => data.y,
              )
            )
          )
        )
      )
    );
  }