Working with charts in Excel document.
27 Oct 202524 minutes to read
Essential® XlsIO has support for creating and modifying Excel charts inside a workbook or as a chart worksheet.
To quickly learn how to work with charts in Excel documents, please check out this video:
Creating a Chart
The IChartShape interface represents the chart in a worksheet. A chart can be created either through the existing data in the worksheet, directly entering series or by adding series one by one.
The following code example illustrates how to create a chart through the existing data in the worksheet.
using (ExcelEngine excelEngine = new ExcelEngine())
{
	IApplication application = excelEngine.Excel;
	application.DefaultVersion = ExcelVersion.Xlsx;
	IWorkbook workbook = application.Workbooks.Open(Path.GetFullPath(@"Data/InputTemplate.xlsx"), ExcelOpenType.Automatic);
	IWorksheet sheet = workbook.Worksheets[0];

	//Create a Chart
	IChartShape chart = sheet.Charts.Add();

	//Set Chart Type
	chart.ChartType = ExcelChartType.Column_Clustered;

	//Set data range in the worksheet
	chart.DataRange = sheet.Range["A1:C6"];
	chart.IsSeriesInRows = false;

	//Set Datalabels
	IChartSerie serie1 = chart.Series[0];
	IChartSerie serie2 = chart.Series[1];

	serie1.DataPoints.DefaultDataPoint.DataLabels.IsValue = true;
	serie2.DataPoints.DefaultDataPoint.DataLabels.IsValue = true;
	serie1.DataPoints.DefaultDataPoint.DataLabels.Position = ExcelDataLabelPosition.Outside;
	serie2.DataPoints.DefaultDataPoint.DataLabels.Position = ExcelDataLabelPosition.Outside;

	//Set Legend
	chart.HasLegend = true;
	chart.Legend.Position = ExcelLegendPosition.Bottom;

	//Positioning the chart in the worksheet
	chart.TopRow = 8;
	chart.LeftColumn = 1;
	chart.BottomRow = 23;
	chart.RightColumn = 8;

	#region Save
	//Saving the workbook
	workbook.SaveAs(Path.GetFullPath("Output/Chart.xlsx"));
	#endregion
}
using (ExcelEngine excelEngine = new ExcelEngine())
{
IApplication application = excelEngine.Excel;
application.DefaultVersion = ExcelVersion.Xlsx;
IWorkbook workbook = application.Workbooks.Open("Sample.xlsx", ExcelOpenType.Automatic);
IWorksheet sheet = workbook.Worksheets[0];
//Create a Chart
IChartShape chart = sheet.Charts.Add();
//Set Chart Type
chart.ChartType = ExcelChartType.Column_Clustered;
//Set data range in the worksheet
chart.DataRange = sheet.Range["A1:E5"];
workbook.SaveAs("Chart.xlsx");
}Using excelEngine As ExcelEngine = New ExcelEngine()
Dim application As IApplication = excelEngine.Excel
application.DefaultVersion = ExcelVersion.Xlsx
Dim workbook As IWorkbook = application.Workbooks.Open("Sample.xlsx", ExcelOpenType.Automatic)
Dim sheet As IWorksheet = workbook.Worksheets(0)
'Create a Chart
Dim chart As IChartShape = sheet.Charts.Add()
'Set Chart Type
chart.ChartType = ExcelChartType.Column_Clustered
'Set data range in the worksheet
chart.DataRange = sheet.Range("A1:E5")
workbook.SaveAs("Chart.xlsx")
End UsingA complete working example to create a chart in C# is present on this GitHub page.
Creating a Chart from directly entered Values
A chart in XlsIO can also be created from directly entered values.
The following code example illustrate how to create a chart from directly entered values.
using (ExcelEngine excelEngine = new ExcelEngine())
{
	IApplication application = excelEngine.Excel;
	application.DefaultVersion = ExcelVersion.Xlsx;
	IWorkbook workbook = application.Workbooks.Create(1);
	IWorksheet sheet = workbook.Worksheets[0];

	object[] yValues = new object[] { 2000, 1000, 1000 };
	object[] xValues = new object[] { "Total Income", "Expenses", "Profit" };

	//Adding series and values
	IChartShape chart = sheet.Charts.Add();
	IChartSerie serie = chart.Series.Add(ExcelChartType.Pie);

	//Enters the X and Y values directly
	serie.EnteredDirectlyValues = yValues;
	serie.EnteredDirectlyCategoryLabels = xValues;

	//Set Legend
	chart.HasLegend = true;
	chart.Legend.Position = ExcelLegendPosition.Bottom;

	//Positioning the chart in the worksheet
	chart.TopRow = 1;
	chart.LeftColumn = 1;
	chart.BottomRow = 16;
	chart.RightColumn = 8;

	#region Save
	//Saving the workbook
	workbook.SaveAs(Path.GetFullPath("Output/Chart.xlsx"));
	#endregion
}
using (ExcelEngine excelEngine = new ExcelEngine())
{
IApplication application = excelEngine.Excel;
application.DefaultVersion = ExcelVersion.Xlsx;
IWorkbook workbook = application.Workbooks.Create(1);
IWorksheet sheet = workbook.Worksheets[0];
object[] yValues = new object[] { 2000, 1000, 1000 };
object[] xValues = new object[] { "Total Income", "Expenses", "Profit" };
//Adding series and values
IChartShape chart = sheet.Charts.Add();
IChartSerie serie = chart.Series.Add(ExcelChartType.Pie);
//Enters the X and Y values directly
serie.EnteredDirectlyValues = yValues;
serie.EnteredDirectlyCategoryLabels = xValues;
workbook.SaveAs("Chart.xlsx");
}Using excelEngine As ExcelEngine = New ExcelEngine()
Dim application As IApplication = excelEngine.Excel
application.DefaultVersion = ExcelVersion.Xlsx
Dim workbook As IWorkbook = application.Workbooks.Create(1)
Dim sheet As IWorksheet = workbook.Worksheets(0)
Dim yValues As Object() = New Object() {2000, 1000, 1000}
Dim xValues As Object() = New Object() {"Total Income", "Expenses", "Profit"}
'Adding series and values
Dim chart As IChartShape = sheet.Charts.Add()
Dim serie As IChartSerie = chart.Series.Add(ExcelChartType.Pie)
'Enters the X and Y values directly
serie.EnteredDirectlyValues = yValues
serie.EnteredDirectlyCategoryLabels = xValues
workbook.SaveAs("Chart.xlsx")
End UsingA complete working example to create a chart from directly entered values in C# is present on this GitHub page.
Creating a Chart by adding Series
A chart can also be created by adding series one by one.
The following code example illustrates how to create a chart through series.
using (ExcelEngine excelEngine = new ExcelEngine())
{
	IApplication application = excelEngine.Excel;
	application.DefaultVersion = ExcelVersion.Xlsx;
	IWorkbook workbook = application.Workbooks.Create(1);
	IWorksheet sheet = workbook.Worksheets[0];

	//Inserts the sample data for the chart
	sheet.Range["A1"].Text = "Month";
	sheet.Range["B1"].Text = "Product A";
	sheet.Range["C1"].Text = "Product B";

	//Months
	sheet.Range["A2"].Text = "Jan";
	sheet.Range["A3"].Text = "Feb";
	sheet.Range["A4"].Text = "Mar";
	sheet.Range["A5"].Text = "Apr";
	sheet.Range["A6"].Text = "May";

	//Create a random Data
	Random r = new Random();
	for (int i = 2; i <= 6; i++)
	{
		for (int j = 2; j <= 3; j++)
		{
			sheet.Range[i, j].Number = r.Next(0, 500);
		}
	}
	IChartShape chart = sheet.Charts.Add();

	//Set chart type
	chart.ChartType = ExcelChartType.Line;

	//Set Chart Title
	chart.ChartTitle = "Product Sales comparison";

	//Set first serie
	IChartSerie productA = chart.Series.Add("ProductA");
	productA.Values = sheet.Range["B2:B6"];
	productA.CategoryLabels = sheet.Range["A2:A6"];

	//Set second serie
	IChartSerie productB = chart.Series.Add("ProductB");
	productB.Values = sheet.Range["C2:C6"];
	productB.CategoryLabels = sheet.Range["A2:A6"];

	//Set Legend
	chart.HasLegend = true;
	chart.Legend.Position = ExcelLegendPosition.Bottom;

	//Positioning the chart in the worksheet
	chart.TopRow = 8;
	chart.LeftColumn = 1;
	chart.BottomRow = 23;
	chart.RightColumn = 8;

	#region Save
	//Saving the workbook
	workbook.SaveAs(Path.GetFullPath("Output/Chart.xlsx"));
	#endregion
}
using (ExcelEngine excelEngine = new ExcelEngine())
{
IApplication application = excelEngine.Excel;
application.DefaultVersion = ExcelVersion.Xlsx;
IWorkbook workbook = application.Workbooks.Create(1);
IWorksheet sheet = workbook.Worksheets[0];
//Inserts the sample data for the chart
sheet.Range["A1"].Text = "Month";
sheet.Range["B1"].Text = "Product A";
sheet.Range["C1"].Text = "Product B";
//Months
sheet.Range["A2"].Text = "Jan";
sheet.Range["A3"].Text = "Feb";
sheet.Range["A4"].Text = "Mar";
sheet.Range["A5"].Text = "Apr";
sheet.Range["A6"].Text = "May";
//Create a random Data
Random r = new Random();
for (int i = 2; i <= 6; i++)
{
for (int j = 2; j <= 3; j++)
{
sheet.Range[i, j].Number = r.Next(0, 500);
}
}
IChartShape chart = sheet.Charts.Add();
//Set chart type
chart.ChartType = ExcelChartType.Line;
//Set Chart Title
chart.ChartTitle = "Product Sales comparison";
//Set first serie
IChartSerie productA = chart.Series.Add("ProductA");
productA.Values = sheet.Range["B2:B6"];
productA.CategoryLabels = sheet.Range["A2:A6"];
//Set second serie
IChartSerie productB = chart.Series.Add("ProductB");
productB.Values = sheet.Range["C2:C6"];
productB.CategoryLabels = sheet.Range["A2:A6"];
workbook.SaveAs("Chart.xlsx");
}Using excelEngine As ExcelEngine = New ExcelEngine()
Dim application As IApplication = excelEngine.Excel
application.DefaultVersion = ExcelVersion.Xlsx
Dim workbook As IWorkbook = application.Workbooks.Create(1)
Dim sheet As IWorksheet = workbook.Worksheets(0)
'Inserting sample data for the chart
sheet.Range("A1").Text = "Month"
sheet.Range("B1").Text = "Product A"
sheet.Range("C1").Text = "Product B"
'Months
sheet.Range("A2").Text = "Jan"
sheet.Range("A3").Text = "Feb"
sheet.Range("A4").Text = "Mar"
sheet.Range("A5").Text = "Apr"
sheet.Range("A6").Text = "May"
'Create a random data
Dim r As Random = New Random
For i As Integer = 2 To 6
For j As Integer = 2 To 3
sheet.Range(i, j).Number = r.Next(0, 500)
Next j
Next i
Dim chart As IChartShape = sheet.Charts.Add()
'Set chart type
chart.ChartType = ExcelChartType.Line
'Set Chart Title
chart.ChartTitle = "Product Sales comparison"
'Set first serie
Dim productA As IChartSerie = chart.Series.Add("ProductA")
productA.Values = sheet.Range("B2:B6")
productA.CategoryLabels = sheet.Range("A2:A6")
'set second serie
Dim productB As IChartSerie = chart.Series.Add("ProductB")
productB.Values = sheet.Range("C2:C6")
productB.CategoryLabels = sheet.Range("A2:A6")
workbook.SaveAs("Chart.xlsx")
End UsingA complete working example to create a chart through series in C# is present on this GitHub page.
Sparkline chart
Sparkline is a small chart in a worksheet cell that provides a visual representation of data.
Creation of sparkline chart
XlsIO provides support for creation, modification and removal of Sparklines.
- ISparklineGroups interface caches the SparklineGroup that need to be added to the Spreadsheet.
- ISparklineGroup represents Sparklines in object, and has properties that allows to customize it.
- ISparklines interface returns the collection of Sparkline present in a Worksheet.
- ISparkline represents a sparkline in the Sparklines. Currently, XlsIO supports all the three types of sparklines - Line, Column, Win/Loss.
The following code example illustrates how to create Sparkline chart.
using (ExcelEngine excelEngine = new ExcelEngine())
{
	IApplication application = excelEngine.Excel;
	application.DefaultVersion = ExcelVersion.Xlsx;
	IWorkbook workbook = application.Workbooks.Open(Path.GetFullPath(@"Data/InputTemplate.xlsx"), ExcelOpenType.Automatic);
	IWorksheet sheet = workbook.Worksheets[0];

	//Add SparklineGroups
	ISparklineGroup sparklineGroup = sheet.SparklineGroups.Add();

	//Add SparkLineType
	sparklineGroup.SparklineType = SparklineType.Line;
	sparklineGroup.MarkersColor = Color.BlueViolet;

	//Add sparklines
	ISparklines sparklines = sparklineGroup.Add();
	IRange dataRange = sheet.Range["D6:G17"];
	IRange referenceRange = sheet.Range["H6:H17"];
	sparklines.Add(dataRange, referenceRange);

	#region Save
	//Saving the workbook
	workbook.SaveAs(Path.GetFullPath("Output/Sparklines.xlsx"));
	#endregion
}
using (ExcelEngine excelEngine = new ExcelEngine())
{
IApplication application = excelEngine.Excel;
application.DefaultVersion = ExcelVersion.Xlsx;
IWorkbook workbook = application.Workbooks.Open("spark.xlsx", ExcelOpenType.Automatic);
IWorksheet sheet = workbook.Worksheets[0];
//Add SparklineGroups
ISparklineGroup sparklineGroup = sheet.SparklineGroups.Add();
//Add SparkLineType
sparklineGroup.SparklineType = SparklineType.Line;
sparklineGroup.MarkersColor = Color.BlueViolet;
//Add sparklines
ISparklines sparklines = sparklineGroup.Add();
IRange dataRange = sheet.Range["B2:F4"];
IRange referenceRange = sheet.Range["G2:G4"];
sparklines.Add(dataRange, referenceRange);
string fileName = "Sparkline.xlsx";
workbook.SaveAs(fileName);
}Using excelEngine As ExcelEngine = New ExcelEngine()
Dim application As IApplication = excelEngine.Excel
application.DefaultVersion = ExcelVersion.Xlsx
Dim workbook As IWorkbook = application.Workbooks.Open("spark.xlsx", ExcelOpenType.Automatic)
Dim sheet As IWorksheet = workbook.Worksheets(0)
'Add SparklineGroups
Dim sparklineGroup As ISparklineGroup = sheet.SparklineGroups.Add()
'Add SparkLineType
sparklineGroup.SparklineType = SparklineType.Line
sparklineGroup.MarkersColor = Color.BlueViolet
'Add sparklines
Dim sparklines As ISparklines = sparklineGroup.Add()
Dim dataRange As IRange = sheet.Range("B2:F4")
Dim referenceRange As IRange = sheet.Range("G2:G4")
sparklines.Add(dataRange, referenceRange)
Dim fileName As String = "Sparkline.xlsx"
workbook.SaveAs(fileName)
End UsingA complete working example to create sparkline chart in C# is present on this GitHub page.
Modifying an existing sparkline chart
XlsIO provides an option to edit the data of existing Sparklines.
The following code example illustrates how to edit an existing sparkline chart.
using (ExcelEngine excelEngine = new ExcelEngine())
{
	IApplication application = excelEngine.Excel;
	application.DefaultVersion = ExcelVersion.Xlsx;
	IWorkbook workbook = application.Workbooks.Open(Path.GetFullPath(@"Data/InputTemplate.xlsx"), ExcelOpenType.Automatic);
	IWorksheet sheet = workbook.Worksheets[0];

	//Edit Sparklines
	ISparklineGroup sparklineGroup = sheet.SparklineGroups[0];
	ISparklines sparklines = sparklineGroup[0];
	IRange dataRange = sheet["D6:F17"];
	IRange referenceRange = sheet["H6:H17"];

	//Edit the existing sparklines data
	sparklines.RefreshRanges(dataRange, referenceRange);

	#region Save
	//Saving the workbook
	workbook.SaveAs(Path.GetFullPath("Output/EditSparklines.xlsx"));
	#endregion
}
using (ExcelEngine excelEngine = new ExcelEngine())
{
IApplication application = excelEngine.Excel;
application.DefaultVersion = ExcelVersion.Xlsx;
IWorkbook workbook = application.Workbooks.Open("Sparkline.xlsx", ExcelOpenType.Automatic);
IWorksheet sheet = workbook.Worksheets[0];
ISparklineGroup sparklineGroup = sheet.SparklineGroups[0];
ISparklines sparklines = sparklineGroup[0];
IRange dataRange = sheet["A1:C4"];
IRange referenceRange = sheet["D1:D4"];
//Edit the existing sparklines data
sparklines.RefreshRanges(dataRange, referenceRange);
workbook.SaveAs("Output.xlsx");
}Using excelEngine As ExcelEngine = New ExcelEngine()
Dim application As IApplication = excelEngine.Excel
application.DefaultVersion = ExcelVersion.Xlsx
Dim workbook As IWorkbook = application.Workbooks.Open("Sparkline.xlsx", ExcelOpenType.Automatic)
Dim sheet As IWorksheet = workbook.Worksheets(0)
Dim sparklineGroup As ISparklineGroup = sheet.SparklineGroups(0)
Dim sparklines As ISparklines = sparklineGroup(0)
Dim dataRange As IRange = sheet("A1:C4")
Dim referenceRange As IRange = sheet("D1:D4")
'Edit the existing sparklines data
sparklines.RefreshRanges(dataRange, referenceRange)
workbook.SaveAs("Output.xlsx")
End UsingA complete working example to edit an existing sparklines in C# is present on this GitHub page.
Removing Sparklines
XlsIO also provides an option to remove sparklines from a sparkline group and to remove the entire sparkline group from the worksheet.
The following code example illustrates how to remove sparklines.
using (ExcelEngine excelEngine = new ExcelEngine())
{
	IApplication application = excelEngine.Excel;
	application.DefaultVersion = ExcelVersion.Xlsx;
	IWorkbook workbook = application.Workbooks.Open(Path.GetFullPath(@"Data/InputTemplate.xlsx"), ExcelOpenType.Automatic);
	IWorksheet sheet = workbook.Worksheets[0];

	ISparklineGroup sparklineGroup = sheet.SparklineGroups[0];
	ISparklines sparklines = sparklineGroup[0];

	//Remove sparkline specified by index from the sparklines
	sparklines.Remove(sparklines[1]);

	//Remove sparklines from the sparkline group
	sparklineGroup.Remove(sparklines);

	//Remove sparkline group from the sheet
	sheet.SparklineGroups.Remove(sparklineGroup);

	#region Save
	//Saving the workbook
	workbook.SaveAs(Path.GetFullPath("Output/RemoveSparklines.xlsx"));
	#endregion
}
using (ExcelEngine excelEngine = new ExcelEngine())
{
IApplication application = excelEngine.Excel;
application.DefaultVersion = ExcelVersion.Xlsx;
IWorkbook workbook = application.Workbooks.Open("Sparkline.xlsx", ExcelOpenType.Automatic);
IWorksheet sheet = workbook.Worksheets[0];
ISparklineGroup sparklineGroup = sheet.SparklineGroups[0];
ISparklines sparklines = sparklineGroup[0];
//Remove sparkline specified by index from the sparklines
sparklines.Remove(sparklines[1]);
//Remove sparklines from the sparkline group
sparklineGroup.Remove(sparklines);
//Remove sparkline group from the sheet
sheet.SparklineGroups.Remove(sparklineGroup);
workbook.SaveAs("Output.xlsx");
}Using excelEngine As ExcelEngine = New ExcelEngine()
Dim application As IApplication = excelEngine.Excel
application.DefaultVersion = ExcelVersion.Xlsx
Dim workbook As IWorkbook = application.Workbooks.Open("Sample.xlsx", ExcelOpenType.Automatic)
Dim sheet As IWorksheet = workbook.Worksheets(0)
Dim sparklineGroup As ISparklineGroup = sheet.SparklineGroups(0)
Dim sparklines As ISparklines = sparklineGroup(0)
'Remove sparkline specified by index from the sparklines
sparklines.Remove(sparklines(1))
'Remove sparklines from the sparkline group
sparklineGroup.Remove(sparklines)
'Remove sparkline group from the sheet
sheet.SparklineGroups.Remove(sparklineGroup)
workbook.SaveAs("Output.xlsx")
End UsingA complete working example to remove sparklines in C# is present on this GitHub page.
NOTE
Sparklines are supported only from Excel 2007 onwards and are ignored in the earlier versions.
Excel 2016 Charts
XlsIO supports creating and manipulating new and modern chart types such as waterfall, histogram, pareto, box and whisker, tree map, and sunburst, all of which are introduced in Microsoft Excel 2016.
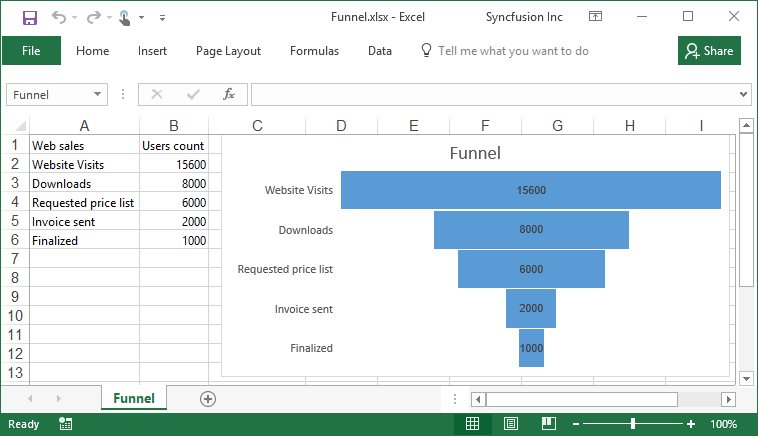
Creating a Funnel chart
A Funnel chart visualizes data progression through stages in a process, displaying it in a funnel shape. Each section’s width corresponds to the magnitude of values at that stage.
The following code example illustrates how to create a Funnel chart.
using (ExcelEngine excelEngine = new ExcelEngine())
{
	IApplication application = excelEngine.Excel;
	application.DefaultVersion = ExcelVersion.Xlsx;
	IWorkbook workbook = application.Workbooks.Open(Path.GetFullPath(@"Data/InputTemplate.xlsx"), ExcelOpenType.Automatic);
	IWorksheet sheet = workbook.Worksheets[0];

	//Create a chart
	IChartShape chart = sheet.Charts.Add();

	//Set chart type as Funnel
	chart.ChartType = ExcelChartType.Funnel;

	//Set data range in the worksheet
	chart.DataRange = sheet.Range["A1:B6"];

	//Set the chart title
	chart.ChartTitle = "Funnel";

	//Formatting the legend and data label option
	chart.HasLegend = false;
	chart.Series[0].DataPoints.DefaultDataPoint.DataLabels.IsValue = true;
	chart.Series[0].DataPoints.DefaultDataPoint.DataLabels.Size = 8;

	//Set Legend
	chart.HasLegend = true;
	chart.Legend.Position = ExcelLegendPosition.Bottom;

	#region Save
	//Saving the workbook
	workbook.SaveAs(Path.GetFullPath("Output/Funnel.xlsx"));
	#endregion
}
using (ExcelEngine excelEngine = new ExcelEngine())
{
IApplication application = excelEngine.Excel;
application.DefaultVersion = ExcelVersion.Excel2016;
IWorkbook workbook = application.Workbooks.Open("Sample.xlsx", ExcelOpenType.Automatic);
IWorksheet sheet = workbook.Worksheets[0];
//Create a chart
IChartShape chart = sheet.Charts.Add();
//Set chart type as Funnel
chart.ChartType = ExcelChartType.Funnel;
//Set data range in the worksheet
chart.DataRange = sheet.Range["A1:B6"];
//Set the chart title
chart.ChartTitle = "Funnel";
//Formatting the legend and data label option
chart.HasLegend = false;
chart.Series[0].DataPoints.DefaultDataPoint.DataLabels.IsValue = true;
chart.Series[0].DataPoints.DefaultDataPoint.DataLabels.Size = 8;
workbook.SaveAs("Funnel.xlsx");
}Using excelEngine As ExcelEngine = New ExcelEngine()
Dim application As IApplication = excelEngine.Excel
application.DefaultVersion = ExcelVersion.Excel2016
Dim workbook As IWorkbook = application.Workbooks.Open("Sample.xlsx", ExcelOpenType.Automatic)
Dim sheet As IWorksheet = workbook.Worksheets(0)
'Create a chart
Dim chart As IChartShape = sheet.Charts.Add()
'Set chart type as Funnel
chart.ChartType = ExcelChartType.Funnel
'Set data range in the worksheet
chart.DataRange = sheet.Range("A1:B6")
'Set the chart title
chart.ChartTitle = "Funnel"
'Formatting the legend and data label option
chart.HasLegend = False
chart.Series(0).DataPoints.DefaultDataPoint.DataLabels.IsValue = True
chart.Series(0).DataPoints.DefaultDataPoint.DataLabels.Size = 8
workbook.SaveAs("Funnel.xlsx")
End UsingA complete working example to create funnel chart in C# is present on this GitHub page.
By executing the program, you will get the Excel file as below
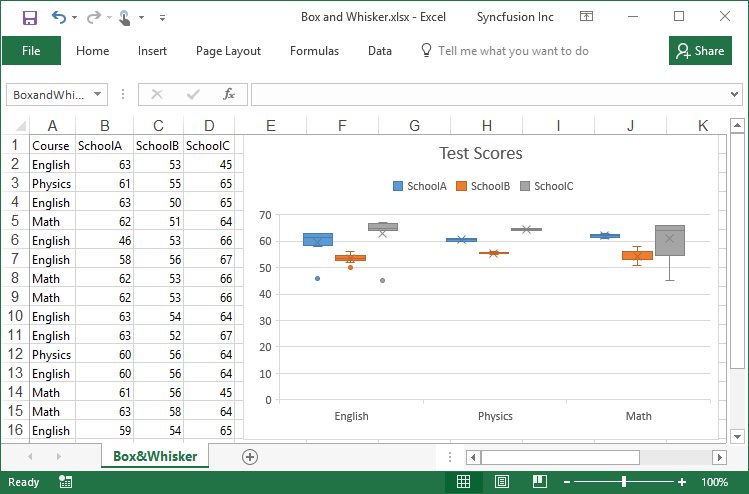
Creating a Box and Whisker chart
Box and Whisker chart shows distribution of data into quartiles, highlighting the mean and outliers. Box and Whisker charts are most commonly used in statistical analysis.
The following code example illustrates how to create Box and Whisker chart.
using (ExcelEngine excelEngine = new ExcelEngine())
{
	IApplication application = excelEngine.Excel;
	application.DefaultVersion = ExcelVersion.Xlsx;
	IWorkbook workbook = application.Workbooks.Open(Path.GetFullPath(@"Data/InputTemplate.xlsx"), ExcelOpenType.Automatic);
	IWorksheet sheet = workbook.Worksheets[0];

	//Create a chart
	IChartShape chart = sheet.Charts.Add();

	//Set the chart title
	chart.ChartTitle = "Test Scores";

	//Set chart type as Box and Whisker
	chart.ChartType = ExcelChartType.BoxAndWhisker;

	//Set data range in the worksheet
	chart.DataRange = sheet["A1:D16"];

	//Box and Whisker settings on first series
	IChartSerie seriesA = chart.Series[0];
	seriesA.SerieFormat.ShowInnerPoints = false;
	seriesA.SerieFormat.ShowOutlierPoints = true;
	seriesA.SerieFormat.ShowMeanMarkers = true;
	seriesA.SerieFormat.ShowMeanLine = false;
	seriesA.SerieFormat.QuartileCalculationType = ExcelQuartileCalculation.ExclusiveMedian;

	//Box and Whisker settings on second series
	IChartSerie seriesB = chart.Series[1];
	seriesB.SerieFormat.ShowInnerPoints = false;
	seriesB.SerieFormat.ShowOutlierPoints = true;
	seriesB.SerieFormat.ShowMeanMarkers = true;
	seriesB.SerieFormat.ShowMeanLine = false;
	seriesB.SerieFormat.QuartileCalculationType = ExcelQuartileCalculation.InclusiveMedian;

	//Box and Whisker settings on third series
	IChartSerie seriesC = chart.Series[2];
	seriesC.SerieFormat.ShowInnerPoints = false;
	seriesC.SerieFormat.ShowOutlierPoints = true;
	seriesC.SerieFormat.ShowMeanMarkers = true;
	seriesC.SerieFormat.ShowMeanLine = false;
	seriesC.SerieFormat.QuartileCalculationType = ExcelQuartileCalculation.ExclusiveMedian;

	//Set Legend
	chart.HasLegend = true;
	chart.Legend.Position = ExcelLegendPosition.Bottom;

	#region Save
	//Saving the workbook
	workbook.SaveAs(Path.GetFullPath("Output/BoxandWhisker.xlsx"));
	#endregion
}
using (ExcelEngine excelEngine = new ExcelEngine())
{
IApplication application = excelEngine.Excel;
application.DefaultVersion = ExcelVersion.Excel2016;
IWorkbook workbook = application.Workbooks.Open("Sample.xlsx", ExcelOpenType.Automatic);
IWorksheet sheet = workbook.Worksheets[0];
//Create a chart
IChartShape chart = sheet.Charts.Add();
//Set the chart title
chart.ChartTitle = "Test Scores";
//Set chart type as Box and Whisker
chart.ChartType = ExcelChartType.BoxAndWhisker;
//Set data range in the worksheet
chart.DataRange = sheet["A1:D16"];
//Box and Whisker settings on first series
IChartSerie seriesA = chart.Series[0];
seriesA.SerieFormat.ShowInnerPoints = false;
seriesA.SerieFormat.ShowOutlierPoints = true;
seriesA.SerieFormat.ShowMeanMarkers = true;
seriesA.SerieFormat.ShowMeanLine = false;
seriesA.SerieFormat.QuartileCalculationType = ExcelQuartileCalculation.ExclusiveMedian;
//Box and Whisker settings on second series
IChartSerie seriesB = chart.Series[1];
seriesB.SerieFormat.ShowInnerPoints = false;
seriesB.SerieFormat.ShowOutlierPoints = true;
seriesB.SerieFormat.ShowMeanMarkers = true;
seriesB.SerieFormat.ShowMeanLine = false;
seriesB.SerieFormat.QuartileCalculationType = ExcelQuartileCalculation.InclusiveMedian;
//Box and Whisker settings on third series
IChartSerie seriesC = chart.Series[2];
seriesC.SerieFormat.ShowInnerPoints = false;
seriesC.SerieFormat.ShowOutlierPoints = true;
seriesC.SerieFormat.ShowMeanMarkers = true;
seriesC.SerieFormat.ShowMeanLine = false;
seriesC.SerieFormat.QuartileCalculationType = ExcelQuartileCalculation.ExclusiveMedian;
workbook.SaveAs("Box and Whisker.xlsx");
}Using excelEngine As ExcelEngine = New ExcelEngine()
Dim application As IApplication = excelEngine.Excel
application.DefaultVersion = ExcelVersion.Excel2016
Dim workbook As IWorkbook = application.Workbooks.Open("Sample.xlsx", ExcelOpenType.Automatic)
Dim sheet As IWorksheet = workbook.Worksheets(0)
'Create a chart
Dim chart As IChartShape = sheet.Charts.Add()
'Set the chart title
chart.ChartTitle = "Test Scores"
'Set chart type as Box and Whisker
chart.ChartType = ExcelChartType.BoxAndWhisker
'Set data range in the worksheet
chart.DataRange = sheet("A1:D16")
'Box and Whisker settings on first series
Dim seriesA As IChartSerie = chart.Series(0)
seriesA.SerieFormat.ShowInnerPoints = False
seriesA.SerieFormat.ShowOutlierPoints = True
seriesA.SerieFormat.ShowMeanMarkers = True
seriesA.SerieFormat.ShowMeanLine = False
seriesA.SerieFormat.QuartileCalculationType = ExcelQuartileCalculation.ExclusiveMedian
'Box and Whisker settings on second series
Dim seriesB As IChartSerie = chart.Series(1)
seriesB.SerieFormat.ShowInnerPoints = False
seriesB.SerieFormat.ShowOutlierPoints = True
seriesB.SerieFormat.ShowMeanMarkers = True
seriesB.SerieFormat.ShowMeanLine = False
seriesB.SerieFormat.QuartileCalculationType = ExcelQuartileCalculation.InclusiveMedian
'Box and Whisker settings on third series
Dim seriesC As IChartSerie = chart.Series(2)
seriesC.SerieFormat.ShowInnerPoints = False
seriesC.SerieFormat.ShowOutlierPoints = True
seriesC.SerieFormat.ShowMeanMarkers = True
seriesC.SerieFormat.ShowMeanLine = False
seriesC.SerieFormat.QuartileCalculationType = ExcelQuartileCalculation.ExclusiveMedian
workbook.SaveAs("Box and Whisker.xlsx")
End UsingA complete working example to create box and whisker chart in C# is present on this GitHub page.
By executing the program, you will get the Excel file as below
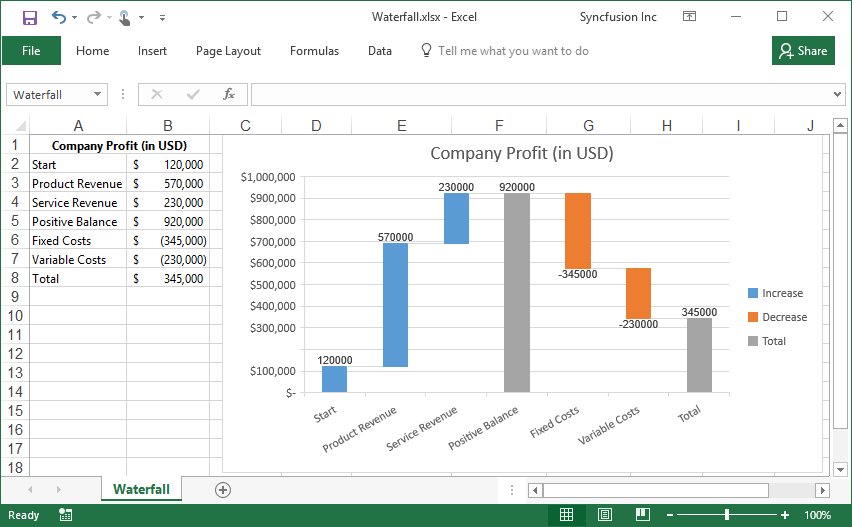
Creating a Waterfall chart
Waterfall chart helps to quickly understand the finances of business owners by viewing profit and loss statements. With a Waterfall chart, you can quickly illustrate the line items in your financial data and get a clear picture of how each item is impacting your bottom line.
The following code example illustrates how to create Waterfall chart.
using (ExcelEngine excelEngine = new ExcelEngine())
{
	IApplication application = excelEngine.Excel;
	application.DefaultVersion = ExcelVersion.Xlsx;
	IWorkbook workbook = application.Workbooks.Open(Path.GetFullPath(@"Data/InputTemplate.xlsx"), ExcelOpenType.Automatic);
	IWorksheet sheet = workbook.Worksheets[0];

	//Create a chart
	IChartShape chart = sheet.Charts.Add();

	//Set chart type as Waterfall
	chart.ChartType = ExcelChartType.WaterFall;

	//Set data range in the worksheet
	chart.DataRange = sheet["A2:B8"];

	//Data point settings as total in chart
	chart.Series[0].DataPoints[3].SetAsTotal = true;
	chart.Series[0].DataPoints[6].SetAsTotal = true;

	//Showing the connector lines between data points
	chart.Series[0].SerieFormat.ShowConnectorLines = true;

	//Set the chart title
	chart.ChartTitle = "Company Profit (in USD)";

	//Formatting data label and legend option
	chart.Series[0].DataPoints.DefaultDataPoint.DataLabels.IsValue = true;
	chart.Series[0].DataPoints.DefaultDataPoint.DataLabels.Size = 8;
	chart.Legend.Position = ExcelLegendPosition.Right;

	#region Save
	//Saving the workbook
	workbook.SaveAs(Path.GetFullPath("Output/Waterfall.xlsx"));
	#endregion
}
using (ExcelEngine excelEngine = new ExcelEngine())
{
IApplication application = excelEngine.Excel;
application.DefaultVersion = ExcelVersion.Excel2016;
IWorkbook workbook = application.Workbooks.Open("Sample.xlsx", ExcelOpenType.Automatic);
IWorksheet sheet = workbook.Worksheets[0];
//Create a chart
IChartShape chart = sheet.Charts.Add();
//Set chart type as Waterfall
chart.ChartType = ExcelChartType.WaterFall;
//Set data range in the worksheet
chart.DataRange = sheet["A2:B8"];
//Data point settings as total in chart
chart.Series[0].DataPoints[3].SetAsTotal = true;
chart.Series[0].DataPoints[6].SetAsTotal = true;
//Showing the connector lines between data points
chart.Series[0].SerieFormat.ShowConnectorLines = true;
//Set the chart title
chart.ChartTitle = "Company Profit (in USD)";
//Formatting data label and legend option
chart.Series[0].DataPoints.DefaultDataPoint.DataLabels.IsValue = true;
chart.Series[0].DataPoints.DefaultDataPoint.DataLabels.Size = 8;
chart.Legend.Position = ExcelLegendPosition.Right;
workbook.SaveAs("Waterfall.xlsx");
}Using excelEngine As ExcelEngine = New ExcelEngine()
Dim application As IApplication = excelEngine.Excel
application.DefaultVersion = ExcelVersion.Excel2016
Dim workbook As IWorkbook = application.Workbooks.Open("Sample.xlsx", ExcelOpenType.Automatic)
Dim sheet As IWorksheet = workbook.Worksheets(0)
'Create a chart
Dim chart As IChartShape = sheet.Charts.Add()
'Set chart type as Waterfall
chart.ChartType = ExcelChartType.WaterFall
'Set data range in the worksheet
chart.DataRange = sheet("A2:B8")
'Datapoint settings as total in chart
chart.Series(0).DataPoints(3).SetAsTotal = True
chart.Series(0).DataPoints(6).SetAsTotal = True
'Showing the connector lines between data points
chart.Series(0).SerieFormat.ShowConnectorLines = True
'Set the chart title
chart.ChartTitle = "Company Profit (in USD)"
'Formatting data label and legend option
chart.Series(0).DataPoints.DefaultDataPoint.DataLabels.IsValue = True
chart.Series(0).DataPoints.DefaultDataPoint.DataLabels.Size = 8
chart.Legend.Position = ExcelLegendPosition.Right
workbook.SaveAs("Waterfall.xlsx")
End UsingA complete working example to create waterfall chart in C# is present on this GitHub page.
By executing the program, you will get the Excel file as below
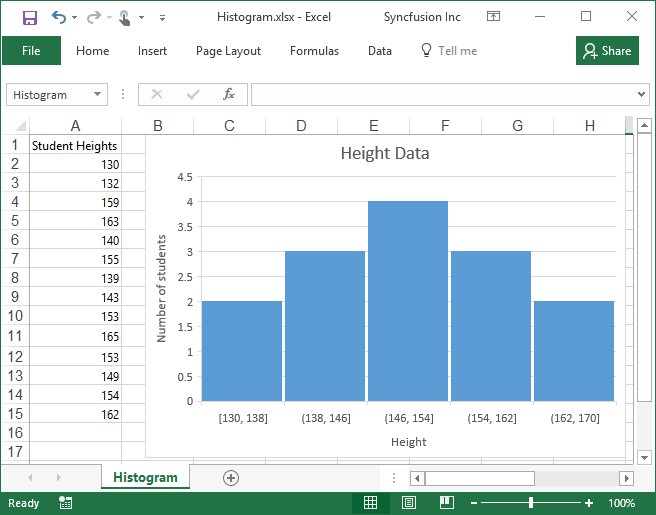
Creation of Histogram chart
A Histogram chart visually represents the frequencies within a distribution of data. It consists of a series of columns, called bins, where each bin represents a range of values.
The following code example illustrates how to create Histogram chart.
using (ExcelEngine excelEngine = new ExcelEngine())
{
	IApplication application = excelEngine.Excel;
	application.DefaultVersion = ExcelVersion.Xlsx;
	IWorkbook workbook = application.Workbooks.Open(Path.GetFullPath(@"Data/InputTemplate.xlsx"), ExcelOpenType.Automatic);
	IWorksheet sheet = workbook.Worksheets[0];

	//Create a chart
	IChartShape chart = sheet.Charts.Add();

	//Set chart type as Histogram
	chart.ChartType = ExcelChartType.Histogram;

	//Set data range in the worksheet
	chart.DataRange = sheet["A1:A15"];

	//Category axis bin settings
	chart.PrimaryCategoryAxis.BinWidth = 8;

	//Gap width settings
	chart.Series[0].SerieFormat.CommonSerieOptions.GapWidth = 6;

	//Set the chart title and axis title
	chart.ChartTitle = "Height Data";
	chart.PrimaryValueAxis.Title = "Number of students";
	chart.PrimaryCategoryAxis.Title = "Height";

	//Hiding the legend
	chart.HasLegend = false;

	#region Save
	//Saving the workbook
	workbook.SaveAs(Path.GetFullPath("Output/Histogram.xlsx"));
	#endregion
}
using (ExcelEngine excelEngine = new ExcelEngine())
{
IApplication application = excelEngine.Excel;
application.DefaultVersion = ExcelVersion.Excel2016;
IWorkbook workbook = application.Workbooks.Open("Sample.xlsx", ExcelOpenType.Automatic);
IWorksheet sheet = workbook.Worksheets[0];
//Create a chart
IChartShape chart = sheet.Charts.Add();
//Set chart type as Histogram
chart.ChartType = ExcelChartType.Histogram;
//Set data range in the worksheet
chart.DataRange = sheet["A1:A15"];
//Category axis bin settings
chart.PrimaryCategoryAxis.BinWidth = 8;
//Gap width settings
chart.Series[0].SerieFormat.CommonSerieOptions.GapWidth = 6;
//Set the chart title and axis title
chart.ChartTitle = "Height Data";
chart.PrimaryValueAxis.Title = "Number of students";
chart.PrimaryCategoryAxis.Title = "Height";
//Hiding the legend
chart.HasLegend = false;
workbook.SaveAs("Histogram.xlsx");
}Using excelEngine As ExcelEngine = New ExcelEngine()
Dim application As IApplication = excelEngine.Excel
application.DefaultVersion = ExcelVersion.Excel2016
Dim workbook As IWorkbook = application.Workbooks.Open("Sample.xlsx", ExcelOpenType.Automatic)
Dim sheet As IWorksheet = workbook.Worksheets(0)
'Create a chart
Dim chart As IChartShape = sheet.Charts.Add()
'Set chart type as Histogram
chart.ChartType = ExcelChartType.Histogram
'Set data range in the worksheet
chart.DataRange = sheet("A1:A15")
'Category axis bin settings
chart.PrimaryCategoryAxis.BinWidth = 8
'Gap width settings
chart.Series(0).SerieFormat.CommonSerieOptions.GapWidth = 6
'Set the chart title and axis title
chart.ChartTitle = "Height Data"
chart.PrimaryValueAxis.Title = "Number of students"
chart.PrimaryCategoryAxis.Title = "Height"
'Hiding the legend
chart.HasLegend = False
workbook.SaveAs("Histogram.xlsx")
End UsingA complete working example to create histogram chart in C# is present on this GitHub page.
By executing the program, you will get the Excel file as below
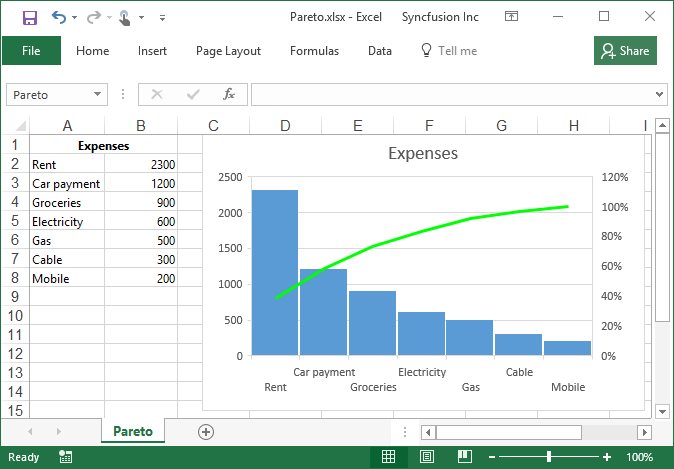
Creation of Pareto chart
Pareto is a sorted histogram where columns sorted in descending order and a line representing the cumulative total percentage.
The following code example illustrates how to create Pareto chart.
using (ExcelEngine excelEngine = new ExcelEngine())
{
	IApplication application = excelEngine.Excel;
	application.DefaultVersion = ExcelVersion.Xlsx;
	IWorkbook workbook = application.Workbooks.Open(Path.GetFullPath(@"Data/InputTemplate.xlsx"), ExcelOpenType.Automatic);
	IWorksheet sheet = workbook.Worksheets[0];

	//Create a chart
	IChartShape chart = sheet.Charts.Add();

	//Set chart type as Pareto
	chart.ChartType = ExcelChartType.Pareto;

	//Set data range in the worksheet
	chart.DataRange = sheet["A2:B8"];

	//Set category values as bin values
	chart.PrimaryCategoryAxis.IsBinningByCategory = true;

	//Formatting Pareto line
	chart.Series[0].ParetoLineFormat.LineProperties.ColorIndex = ExcelKnownColors.Bright_green;

	//Gap width settings
	chart.Series[0].SerieFormat.CommonSerieOptions.GapWidth = 6;

	//Set the chart title
	chart.ChartTitle = "Expenses";

	//Hiding the legend
	chart.HasLegend = false;

	#region Save
	//Saving the workbook
	workbook.SaveAs(Path.GetFullPath("Output/Pareto.xlsx"));
	#endregion
}
using (ExcelEngine excelEngine = new ExcelEngine())
{
IApplication application = excelEngine.Excel;
application.DefaultVersion = ExcelVersion.Excel2016;
IWorkbook workbook = application.Workbooks.Open("Sample.xlsx", ExcelOpenType.Automatic);
IWorksheet sheet = workbook.Worksheets[0];
//Create a chart
IChartShape chart = sheet.Charts.Add();
//Set chart type as Pareto
chart.ChartType = ExcelChartType.Pareto;
//Set data range in the worksheet
chart.DataRange = sheet["A2:B8"];
//Set category values as bin values
chart.PrimaryCategoryAxis.IsBinningByCategory = true;
//Formatting Pareto line
chart.Series[0].ParetoLineFormat.LineProperties.ColorIndex = ExcelKnownColors.Bright_green;
//Gap width settings
chart.Series[0].SerieFormat.CommonSerieOptions.GapWidth = 6;
//Set the chart title
chart.ChartTitle = "Expenses";
//Hiding the legend
chart.HasLegend = false;
workbook.SaveAs("Pareto.xlsx");
}Using excelEngine As ExcelEngine = New ExcelEngine()
Dim application As IApplication = excelEngine.Excel
application.DefaultVersion = ExcelVersion.Excel2016
Dim workbook As IWorkbook = application.Workbooks.Open("Sample.xlsx", ExcelOpenType.Automatic)
Dim sheet As IWorksheet = workbook.Worksheets(0)
'Create a chart
Dim chart As IChartShape = sheet.Charts.Add()
'Set chart type as Pareto
chart.ChartType = ExcelChartType.Pareto
'Set data range in the worksheet
chart.DataRange = sheet("A2:B8")
'Set category axis as bin option
chart.PrimaryCategoryAxis.IsBinningByCategory = True
'Formatting Pareto line
chart.Series(0).ParetoLineFormat.LineProperties.ColorIndex = ExcelKnownColors.Bright_green
'Gap width settings
chart.Series(0).SerieFormat.CommonSerieOptions.GapWidth = 6
'Set the chart title
chart.ChartTitle = "Expenses"
'Hiding the legend
chart.HasLegend = False
workbook.SaveAs("Pareto.xlsx")
End UsingA complete working example to create pareto chart in C# is present on this GitHub page.
By executing the program, you will get the Excel file as below
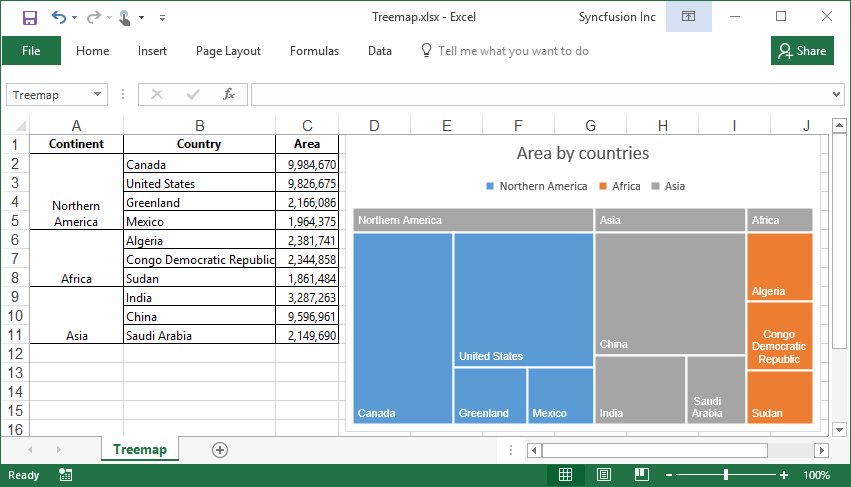
Creation of Treemap chart
Treemap provides a hierarchical view of data as clustered rectangle with a specific weighted attribute determining the size of the rectangle.
The following code example illustrates how to create Treemap chart.
using (ExcelEngine excelEngine = new ExcelEngine())
{
	IApplication application = excelEngine.Excel;
	application.DefaultVersion = ExcelVersion.Xlsx;
	IWorkbook workbook = application.Workbooks.Open(Path.GetFullPath(@"Data/InputTemplate.xlsx"), ExcelOpenType.Automatic);
	IWorksheet sheet = workbook.Worksheets[0];

	//Create a chart
	IChartShape chart = sheet.Charts.Add();

	//Set chart type as TreeMap
	chart.ChartType = ExcelChartType.TreeMap;

	//Set data range in the worksheet
	chart.DataRange = sheet["A2:C11"];

	//Set the chart title
	chart.ChartTitle = "Area by countries";

	//Set the Treemap label option
	chart.Series[0].SerieFormat.TreeMapLabelOption = ExcelTreeMapLabelOption.Banner;

	//Formatting data labels
	chart.Series[0].DataPoints.DefaultDataPoint.DataLabels.Size = 8;

	#region Save
	//Saving the workbook
	workbook.SaveAs(Path.GetFullPath("Output/Treemap.xlsx"));
	#endregion
}
using (ExcelEngine excelEngine = new ExcelEngine())
{
IApplication application = excelEngine.Excel;
application.DefaultVersion = ExcelVersion.Excel2016;
IWorkbook workbook = application.Workbooks.Open("Sample.xlsx", ExcelOpenType.Automatic);
IWorksheet sheet = workbook.Worksheets[0];
//Create a chart
IChartShape chart = sheet.Charts.Add();
//Set chart type as TreeMap
chart.ChartType = ExcelChartType.TreeMap;
//Set data range in the worksheet
chart.DataRange = sheet["A2:C11"];
//Set the chart title
chart.ChartTitle = "Area by countries";
//Set the Treemap label option
chart.Series[0].SerieFormat.TreeMapLabelOption = ExcelTreeMapLabelOption.Banner;
//Formatting data labels
chart.Series[0].DataPoints.DefaultDataPoint.DataLabels.Size = 8;
workbook.SaveAs("Treemap.xlsx");
}Using excelEngine As ExcelEngine = New ExcelEngine()
Dim application As IApplication = excelEngine.Excel
application.DefaultVersion = ExcelVersion.Excel2016
Dim workbook As IWorkbook = application.Workbooks.Open("Sample.xlsx", ExcelOpenType.Automatic)
Dim sheet As IWorksheet = workbook.Worksheets(0)
'Create a chart
Dim chart As IChartShape = sheet.Charts.Add()
'Set chart type as TreeMap
chart.ChartType = ExcelChartType.TreeMap
'Set data range in the worksheet
chart.DataRange = sheet("A2:C11")
'Set the chart title
chart.ChartTitle = "Area by countries"
'Set the Treemap label option
chart.Series(0).SerieFormat.TreeMapLabelOption = ExcelTreeMapLabelOption.Banner
'Formatting data labels
chart.Series(0).DataPoints.DefaultDataPoint.DataLabels.Size = 8
workbook.SaveAs("Treemap.xlsx")
End UsingA complete working example to create treemap chart in C# is present on this GitHub page.
By executing the program, you will get the Excel file as below
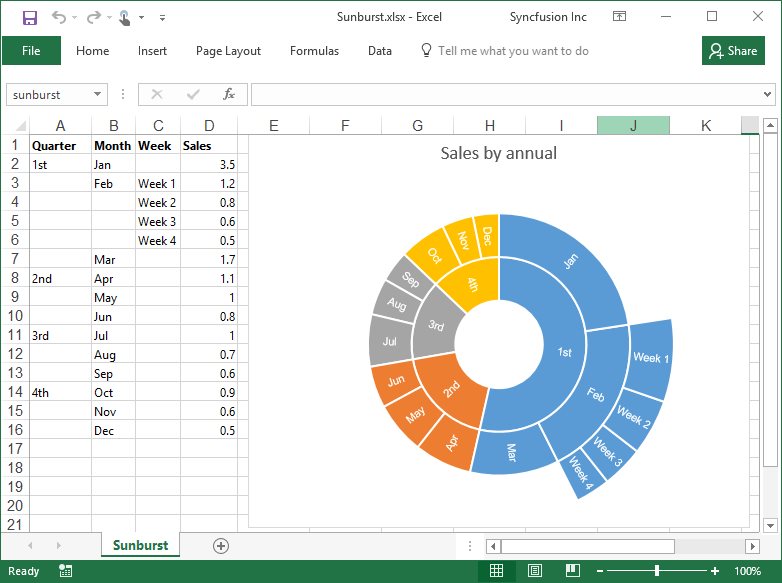
Creation of Sunburst chart
Sunburst provides a hierarchical view of data where each level of the hierarchy is represented by one ring or circle with the innermost circle as the top of the hierarchy.
The following code example illustrates how to create Sunburst chart.
using (ExcelEngine excelEngine = new ExcelEngine())
{
	IApplication application = excelEngine.Excel;
	application.DefaultVersion = ExcelVersion.Xlsx;
	IWorkbook workbook = application.Workbooks.Open(Path.GetFullPath(@"Data/InputTemplate.xlsx"), ExcelOpenType.Automatic);
	IWorksheet sheet = workbook.Worksheets[0];

	//Create a chart
	IChartShape chart = sheet.Charts.Add();

	//Set chart type as Sunburst
	chart.ChartType = ExcelChartType.SunBurst;

	//Set data range in the worksheet
	chart.DataRange = sheet["A1:D16"];

	//Set the chart title
	chart.ChartTitle = "Sales by annual";

	//Formatting data labels
	chart.Series[0].DataPoints.DefaultDataPoint.DataLabels.Size = 8;

	//Hiding the legend
	chart.HasLegend = false;

	#region Save
	//Saving the workbook
	workbook.SaveAs(Path.GetFullPath("Output/Sunburst.xlsx"));
	#endregion
}
using (ExcelEngine excelEngine = new ExcelEngine())
{
IApplication application = excelEngine.Excel;
application.DefaultVersion = ExcelVersion.Excel2016;
IWorkbook workbook = application.Workbooks.Open("Sample.xlsx", ExcelOpenType.Automatic);
IWorksheet sheet = workbook.Worksheets[0];
//Create a chart
IChartShape chart = sheet.Charts.Add();
//Set chart type as Sunburst
chart.ChartType = ExcelChartType.SunBurst;
//Set data range in the worksheet
chart.DataRange = sheet["A1:D16"];
//Set the chart title
chart.ChartTitle = "Sales by annual";
//Formatting data labels
chart.Series[0].DataPoints.DefaultDataPoint.DataLabels.Size = 8;
//Hiding the legend
chart.HasLegend = false;
workbook.SaveAs("Sunburst.xlsx");
}Using excelEngine As ExcelEngine = New ExcelEngine()
Dim application As IApplication = excelEngine.Excel
application.DefaultVersion = ExcelVersion.Excel2016
Dim workbook As IWorkbook = application.Workbooks.Open("Sample.xlsx", ExcelOpenType.Automatic)
Dim sheet As IWorksheet = workbook.Worksheets(0)
'Create a chart
Dim chart As IChartShape = sheet.Charts.Add()
'Set chart type as Sunburst
chart.ChartType = ExcelChartType.SunBurst
'Set data range in the worksheet
chart.DataRange = sheet("A1:D16")
'Set the chart title
chart.ChartTitle = "Sales by annual"
'Formatting data labels
chart.Series(0).DataPoints.DefaultDataPoint.DataLabels.Size = 8
'Hiding the legend
chart.HasLegend = False
workbook.SaveAs("Sunburst.xlsx")
End UsingA complete working example to create sunburst chart in C# is present on this GitHub page.
By executing the program, you will get the Excel file as below
NOTE
These Charts are supported only in Excel 2016 and are not visible in the earlier versions.
Customizing the chart and its elements
A chart is composed of various elements such as chart area, plot area, legend, axis, series, data labels etc. These elements can be customized to enhance the visual presentation.
Elements of Chart
The following image illustrates the basic elements of a chart.
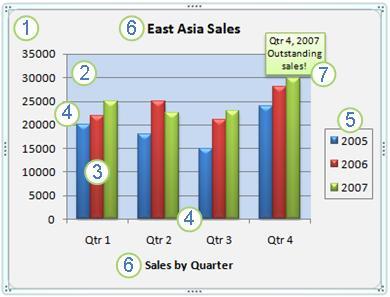
- The chart area of the chart.
- The plot area of the chart.
- The data points of the data series that are plotted in the chart.
- The horizontal (category) and vertical (value) axis along which the data is plotted in the chart.
- The legend of the chart.
- A chart axis title that you can use in the chart.
- A data label that you can use to identify the details of a data point in a data series.
Chart Title
With the Syncfusion® Excel Library, you can customize the chart title by changing its name, font, color, position and more. Click here for more details.
Chart Area
With the Syncfusion® Excel Library, you can customize the chart area by changing its border, color and transparency. Click here for more details.
Chart Plot Area
With the Syncfusion® Excel Library, you can customize the chart plot area by changing its border, color, transparency and position. Click here for more details.
Chart Series
With the Syncfusion® Excel Library, you can customize the chart series by changing the series name, type, color, border, and more. Click here for more details.
Chart Legend
With the Syncfusion® Excel Library, you can customize the chart legend by changing its border, color, font, position, and more. Click here for more details.
Chart Data Labels
With the Syncfusion® Excel Library, you can customize the chart data labels by changing its color, font and position. Click here for more details.
Chart Axis
With the Syncfusion® Excel Library, you can customize the chart axes by changing the title, border, font, rotation angle and more. Click here for more details.
Chart Appearance
Chart appearance refers to the ability to customize the visual aspects of charts in your Excel documents. This includes modifying elements such as the chart area, plot area, series, legend etc. These customizations enhance the readability, aesthetics, and overall presentation of the charts. Beyond these standard elements, users can further refine the chart’s appearance by utilizing Fill Settings, Adding Pictures in Chart, Positioning and Resizing, adding a Data Table to the chart, and applying 3D formats.
With the Syncfusion® Excel Library, you can customize various aspects of chart appearance in your Excel documents. Click here for more details.
Positioning a Chart
The following code example illustrates how to position a chart in Excel.
using (ExcelEngine excelEngine = new ExcelEngine())
{
	IApplication application = excelEngine.Excel;
  application.DefaultVersion = ExcelVersion.Xlsx;
  IWorkbook workbook = application.Workbooks.Create(1);
  IWorksheet worksheet = workbook.Worksheets[0];

  //Add data
  worksheet.Range["A1"].Text = "Category";
  worksheet.Range["B1"].Text = "Value";
  worksheet.Range["A2"].Text = "A";
  worksheet.Range["A3"].Text = "B";
  worksheet.Range["A4"].Text = "C";
  worksheet.Range["B2"].Number = 10;
  worksheet.Range["B3"].Number = 20;
  worksheet.Range["B4"].Number = 30;

  //Add a chart
  IChartShape chart = worksheet.Charts.Add();
  chart.DataRange = worksheet.Range["A1:B4"];
  chart.ChartType = ExcelChartType.Column_Clustered;

  //Set chart position
  chart.Top = 100;
  chart.Left = 150;

  //Set height and width
  IChart chart1 = worksheet.Charts[0];
  chart1.Height = 300;
  chart1.Width = 500;

  #region Save
  //Saving the workbook
  workbook.SaveAs("Output.xlsx");
  #endregion
}
using (ExcelEngine excelEngine = new ExcelEngine())
{
IApplication application = excelEngine.Excel;
application.DefaultVersion = ExcelVersion.Xlsx;
IWorkbook workbook = application.Workbooks.Create(1);
IWorksheet worksheet = workbook.Worksheets[0];
//Add data
worksheet.Range["A1"].Text = "Category";
worksheet.Range["B1"].Text = "Value";
worksheet.Range["A2"].Text = "A";
worksheet.Range["A3"].Text = "B";
worksheet.Range["A4"].Text = "C";
worksheet.Range["B2"].Number = 10;
worksheet.Range["B3"].Number = 20;
worksheet.Range["B4"].Number = 30;
//Add a chart
IChartShape chart = worksheet.Charts.Add();
chart.DataRange = worksheet.Range["A1:B4"];
chart.ChartType = ExcelChartType.Column_Clustered;
//Set chart position
chart.Top = 100;
chart.Left = 150;
//Set height and width
IChart chart1 = worksheet.Charts[0];
chart1.Height = 300;
chart1.Width = 500;
workbook.SaveAs("Output.xlsx");
}Using excelEngine As New ExcelEngine()
Dim application As IApplication = excelEngine.Excel
application.DefaultVersion = ExcelVersion.Xlsx
Dim workbook As IWorkbook = application.Workbooks.Create(1)
Dim worksheet As IWorksheet = workbook.Worksheets(0)
'Add data
worksheet.Range("A1").Text = "Category"
worksheet.Range("B1").Text = "Value"
worksheet.Range("A2").Text = "A"
worksheet.Range("A3").Text = "B"
worksheet.Range("A4").Text = "C"
worksheet.Range("B2").Number = 10
worksheet.Range("B3").Number = 20
worksheet.Range("B4").Number = 30
'Add a chart
Dim chart As IChartShape = worksheet.Charts.Add()
chart.DataRange = worksheet.Range("A1:B4")
chart.ChartType = ExcelChartType.Column_Clustered
'Set chart position
chart.Top = 100
chart.Left = 150
'Set height and width
Dim chart1 As IChart = worksheet.Charts(0)
chart1.Height = 300
chart1.Width = 500
workbook.SaveAs("Output.xlsx")
End UsingA complete working example to position chart in C# is present on this GitHub page.
Removing a Chart
The following code example illustrates how to remove the chart from the worksheet using Remove method.
using (ExcelEngine excelEngine = new ExcelEngine())
{
	IApplication application = excelEngine.Excel;
	application.DefaultVersion = ExcelVersion.Xlsx;
	IWorkbook workbook = application.Workbooks.Open(Path.GetFullPath(@"Data/InputTemplate.xlsx"), ExcelOpenType.Automatic);
	IWorksheet sheet = workbook.Worksheets[0];
	IChartShape chart = sheet.Charts[0];

	//Remove the chart from the worksheet
	chart.Remove();

	#region Save
	//Saving the workbook
	workbook.SaveAs(Path.GetFullPath("Output/Chart.xlsx"));
	#endregion
}
using (ExcelEngine excelEngine = new ExcelEngine())
{
IApplication application = excelEngine.Excel;
application.DefaultVersion = ExcelVersion.Xlsx;
IWorkbook workbook = application.Workbooks.Open("InputTemplate.xlsx", ExcelOpenType.Automatic);
IWorksheet sheet = workbook.Worksheets[0];
IChartShape chart = sheet.Charts[0];
//Remove the chart from the worksheet
chart.Remove();
workbook.SaveAs("Output.xlsx");
}Using excelEngine As ExcelEngine = New ExcelEngine()
Dim application As IApplication = excelEngine.Excel
application.DefaultVersion = ExcelVersion.Xlsx
Dim workbook As IWorkbook = application.Workbooks.Open("InputTemplate.xlsx", ExcelOpenType.Automatic)
Dim sheet As IWorksheet = workbook.Worksheets(0)
Dim chart As IChartShape = sheet.Charts(0)
'Remove the chart from the worksheet
chart.Remove()
workbook.SaveAs("Output.xlsx")
End UsingA complete working example to remove chart in C# is present on this GitHub page.
Supported Chart Types
The following chart types are supported in XlsIO.
- Area
- Area_3D
- Area_Stacked
- Area_Stacked_100
- Area_Stacked_100_3D
- Area_Stacked_3D
- Bar_Clustered
- Bar_Clustered_3D
- Bar_Stacked
- Bar_Stacked_100
- Bar_Stacked_100_3D
- Bar_Stacked_3D
- Bubble
- Bubble_3D
- Column_3D
- Column_Clustered
- Column_Clustered_3D
- Column_Stacked
- Column_Stacked_100
- Column_Stacked_100_3D
- Column_Stacked_3D
- Combination_Chart
- Cone_Bar_Clustered
- Cone_Bar_Stacked
- Cone_Bar_Stacked_100
- Cone_Clustered
- Cone_Clustered_3D
- Cone_Stacked
- Cone_Stacked_100
- Cylinder_Bar_Clustered
- Cylinder_Bar_Stacked
- Cylinder_Bar_Stacked_100
- Cylinder_Clustered
- Cylinder_Clustered_3D
- Cylinder_Stacked
- Cylinder_Stacked_100
- Doughnut
- Doughnut_Exploded
- Line
- Line_3D
- Line_Markers
- Line_Markers_Stacked
- Line_Markers_Stacked_100
- Line_Stacked
- Line_Stacked_100
- Pie
- Pie_3D
- Pie_Bar
- Pie_Exploded
- Pie_Exploded_3D
- PieOfPie
- Pyramid_Bar_Clustered
- Pyramid_Bar_Stacked
- Pyramid_Bar_Stacked_100
- Pyramid_Clustered
- Pyramid_Clustered_3D
- Pyramid_Stacked
- Pyramid_Stacked_100
- Radar
- Radar_Filled
- Radar_Markers
- Scatter_Line
- Scatter_Line_Markers
- Scatter_Markers
- Scatter_SmoothedLine
- Scatter_SmoothedLine_Markers
- Stock_HighLowClose
- Stock_OpenHighLowClose
- Stock_VolumeHighLowClose
- Stock_VolumeOpenHighLowClose
- Surface_3D
- Surface_Contour
- Surface_NoColor_3D
- Surface_NoColor_Contour
- Funnel
- Box and Whisker
- Waterfall
- Histogram
- Pareto
- Treemap
- Sunburst
See Also
- How to add chart title with formula in C#, VB.NET?
- How to create Excel area chart in C#, VB.NET?
- How to set shadows for plot area or axis in chart using XlsIO?
- How to position and re-size a plot area of chart using WinForms XlsIO?
- How to delete Excel chart legend in C#, VB.NET?
- Show or hide Excel chart legend in C#, VB.NET
- Add Excel chart data labels with formula in C#, VB.NET using XlsIO
- Format Excel chart data label in C#, VB.NET
- How to set the DataLabel position for chart series using XlsIO?
- How to set vertical axis crosses value for chart axis in C#, VB.NET?
- How to reverse Excel chart axis order in C#, VB.NET?
- How to filter Excel chart series in C#, VB.NET?
- How to change Excel chart series color in C#, VB.NET?
- How to set trendlines for Excel chart series in C#, VB.NET?
- Blog: Easily Create Dynamic Charts in Excel Using C#