How can I help you?
Working with Data
Local Data
The local data can be provided to chart by using the following two ways:
- Bind the data to chart by using the DataSource property of the series, and then map the X and Y values with XName and YName properties, respectively.
NOTE
For OHLC type series, you should map four data source fields, namely High, Low, Open, and Close to bind the data source. For bubble series, you should map the Size field along with the XName and YName properties.
<ej-chart id="chart" load="onChartLoad"></ej-chart>var chartData = [
{ month: 'Jan', sales: 35 }, { month: 'Feb', sales: 28 }, { month: 'Mar', sales: 34 },
{ month: 'Apr', sales: 32 },{ month: 'May', sales: 40 },{ month: 'Jun', sales: 32 },
{ month: 'Jul', sales: 35 }, { month: 'Aug', sales: 55 }, { month: 'Sep', sales: 38 },
{ month: 'Oct', sales: 30 }, { month: 'Nov', sales: 25 }, { month: 'Dec', sales: 32 }];
function onChartLoad(sender) {
sender.model.series[0].dataSource = chartData;
sender.model.series[0].xName = "month";
sender.model.series[0].yName = "sales";
}
- You can also plot the data to chart by using Points option in the series. By using this option, you can customize each and every point in the data.
<ej-chart id="chart">
    <e-chart-series>
        <e-series>
            <e-points>
                <e-point x="John" y="10000"></e-point>
                <e-point x="Jake" y="12000"></e-point>
                <e-point x="Petter" y="18000"></e-point>
                <e-point x="James" y="11000"></e-point>
                <e-point x="Mary" y="9700"></e-point>
            </e-points>
        </e-series>
    </e-chart-series>
</ej-chart>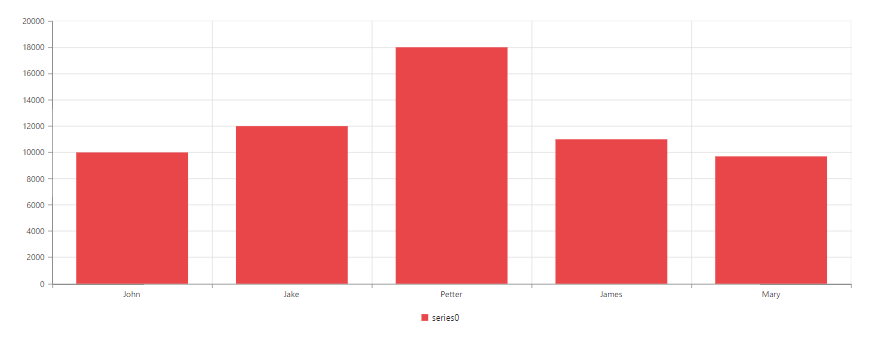
Remote Data
The remote data can be provided to the chart by using the DataManager option. You can use the query property of the series to filter the data from the data source.
<ej-chart id="container">
            <e-chart-series>
                <e-series type="Column" query="ej.Query().from('Orders').take(10)" x-name="ShipCity" y-name="Freight" >
                    <e-datamanager url="http://mvc.syncfusion.com/Services/Northwnd.svc/" cross-domain="true"></e-datamanager>
                </e-series>
            </e-chart-series>
        </ej-chart>