How can I help you?
Multiple panes
Chart area can be divided into multiple panes by using the RowDefinitions and ColumnDefinitions properties.
Row definitions
To split the chart area vertically into a number of rows, use RowDefinitions property of the chart.
-
You can allocate space for each row by using the Unit option that determines whether the chart area should be split by percentage or pixels for the given RowHeight value of the row definitions.
-
To associate a vertical axis to a row, specify the RowDefinitions’ Index value to the RowIndex property of the chart axis.
-
To customize each row’s horizontal line, use LineColor and LineWidth properties.
<ej-chart id="chartContainer">
    // ...
    <e-row-definitions>
        <e-row-definition unit="percentage" line-color="Gray" line-width="0" row-height="50"></e-row-definition>
        <e-row-definition unit="percentage" line-color="green" line-width="0" row-height="50"></e-row-definition>
    </e-row-definitions>
    <e-axes><e-axis name="yAxis1" row-index="1"></e-axis></e-axes>
    <e-chart-series>
        <e-series y-axis-name="yAxis1"></e-series>
    </e-chart-series>
    // ...
</ej-chart>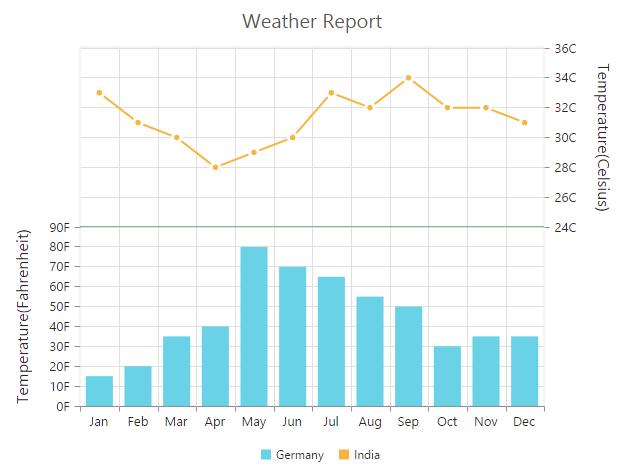
Row span
For spanning the vertical axis along multiple panes vertically, use RowSpan property of axis.
<ej-chart id="chartContainer">
    // ...
    <e-row-definitions>
        //...
    </e-row-definitions>
    <e-axes>
        //...
    </e-axes>
    <e-primary-y-axis row-span="2"></e-primary-y-axis>
    <e-chart-series>
        //...
    </e-chart-series>
    // ...
</ej-chart>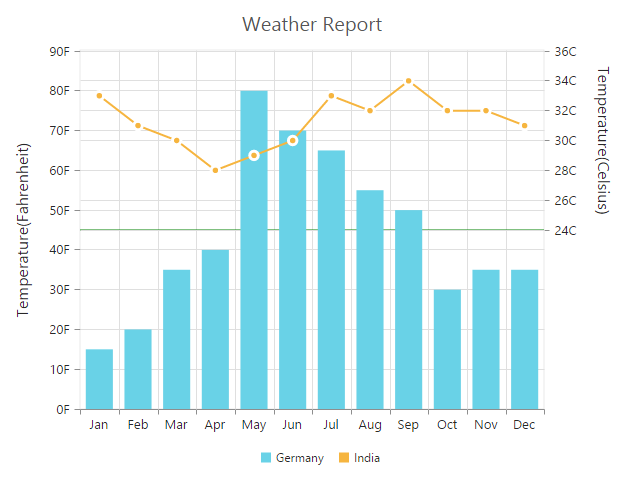
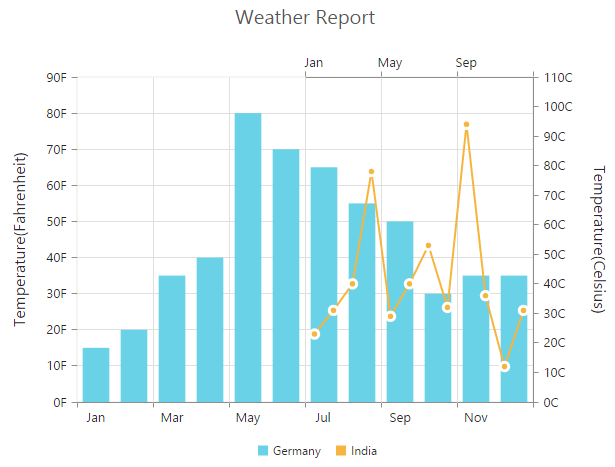
Column definitions
To split the chart area horizontally into a number of columns, use ColumnDefinitions property of the chart.
-
You can allocate space for each column by using the Unit option that determines whether the chart area should be split by percentage or pixels for the given ColumnWidth value of the column definitions.
-
To associate a horizontal axis to a column, specify the ColumnDefinitions’ Index value to the ColumnIndex property of the chart axis.
<ej-chart id="chartContainer">
    // ...
    <e-column-definitions>
        <e-column-definition unit="percentage" column-width="50"></e-column-definition>
        <e-column-definition unit="percentage" column-width="50"></e-column-definition>
    </e-column-definitions>
    <e-axes>
        <e-axis name="xAxis1" column-index="1">
        </e-axis>
    </e-axes>
    <e-chart-series>
        <e-series x-axis-name="xAxis1"></e-series>
    </e-chart-series>
    // ...
</ej-chart>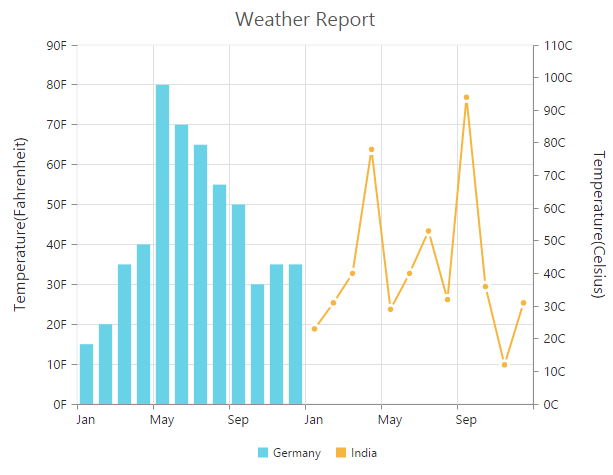
Column span
For spanning the horizontal axis along multiple panes horizontally, use ColumnSpan property of axis.
<ej-chart id="chartContainer">
    // ...
    <e-column-definitions>
        //...
    </e-column-definitions>
    <e-primary-x-axis name="xAxis1" column-span="2"></e-primary-x-axis>
    <e-axes>
        //...
    </e-axes>
    <e-chart-series>
        //...
    </e-chart-series>
    // ...
</ej-chart>