How can I help you?
SfChart Series Types
25 Nov 20227 minutes to read
Multiple Series
You can add multiple series using Series property of SfChart class. By default, all the series rendered based on the PrimaryAxis and SecondaryAxis of SfChart. But if you want to plot different unit or value that is specific to particular series, you can specify the separate axis for that series using XAxis and YAxis properties of ChartSeries.
[C#]

SfChart chart = new SfChart();
...

ColumnSeries columnSeries1 = new ColumnSeries()
{
	ItemsSource = Data1,
    XBindingPath = "Country",
    YBindingPath = "Count"
};
chart.Series.Add(columnSeries1);

ColumnSeries columnSeries2 = new ColumnSeries()
{
	ItemsSource = Data2,
	XBindingPath = "Country",
    YBindingPath = "Count"
};
chart.Series.Add(columnSeries2);

ColumnSeries columnSeries3 = new ColumnSeries()
{
	ItemsSource = Data3,
	XBindingPath = "Country",
    YBindingPath = "Count"
};
chart.Series.Add(columnSeries3);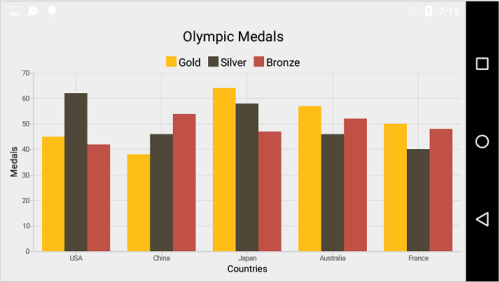
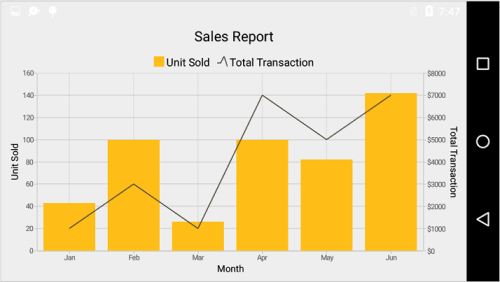
Following code snippet shows how to apply the Y axis to individual series to plot different values.
[C#]

ColumnSeries series = new ColumnSeries();

series.ItemsSource = model.Demands;

series.XBindingPath = "XValue";

series.YBindingPath = "YValue";

series.Label = "Revenue";

chart.Series.Add(series);

LineSeries lineSeries = new LineSeries();

lineSeries.ItemsSource = model.Demands;

lineSeries.XBindingPath = "XValue";

lineSeries.YBindingPath = "YValue";

lineSeries.Label = "Customers";

NumericalAxis yAxis = new NumericalAxis();

yAxis.OpposedPosition = true;

yAxis.Title.Text = "Number of Customers";

lineSeries.YAxis = yAxis;

chart.Series.Add(lineSeries);
Combination Series
SfChart allows you to render the combination of different types of series.
[C#]

SfChart chart = new SfChart();
...

ColumnSeries columnSeries = new ColumnSeries()
{
	ItemsSource = Data1,
	XBindingPath = "Month",
    YBindingPath = "Unit"
};
chart.Series.Add(columnSeries);

LineSeries lineSeries = new LineSeries()
{
	ItemsSource = Data2,
	XBindingPath = "Month",
    YBindingPath = "Unit"
};
Limitation of Combination Chart
- Bar, StackingBar, and StackingBar100 cannot be combined with the other Cartesian type series.
- Cartesian type series cannot be combined with accumulation series (pie, doughnut, funnel, and pyramid).
When the combination of Cartesian and accumulation series types are added to the series collection, the series which are similar to the first series will be rendered and other series will be ignored. Following code snippet illustrates this.
SfChart chart = new SfChart();
...

LineSeries lineSeries = new LineSeries()
{
	ItemsSource = Data1,
	XBindingPath = "Month",
    YBindingPath = "Unit"
};
chart.Series.Add(lineSeries);

PieSeries pieSeries = new PieSeries()
{
	ItemsSource = Data2,
	XBindingPath = "Month",
    YBindingPath = "Unit"
};
chart.Series.Add(pieSeries);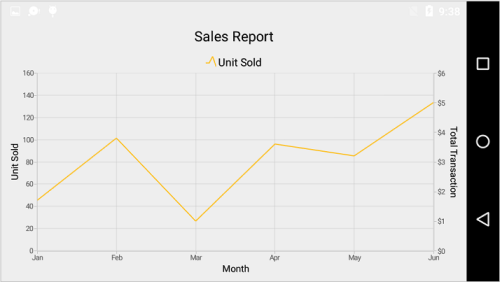
Grouping Stacked Series
You can group and stack the similar stacked series types using GroupingLabel property of stacked series. The stacked series which contains the same GroupingLabel will be stacked in a single group.
[C#]

StackingColumnSeries stackingColumnSeries1 = new StackingColumnSeries();
stackingColumnSeries1.ItemsSource = Data1;
stackingColumnSeries1.XBindingPath = "Year";
stackingColumnSeries1.YBindingPath = "Visitors";
stackingColumnSeries1.GroupingLabel = "GroupOne";
stackingColumnSeries1.Label = "Google";
chart.Series.Add(stackingColumnSeries1);

StackingColumnSeries stackingColumnSeries2 = new StackingColumnSeries();
stackingColumnSeries2.ItemsSource = Data2;
stackingColumnSeries2.XBindingPath = "Year";
stackingColumnSeries2.YBindingPath = "Visitors";
stackingColumnSeries2.GroupingLabel = "GroupTwo";
stackingColumnSeries2.Label = "Bing";
chart.Series.Add(stackingColumnSeries2);

StackingColumnSeries stackingColumnSeries3 = new StackingColumnSeries();
stackingColumnSeries3.ItemsSource = Data3;
stackingColumnSeries3.XBindingPath = "Year";
stackingColumnSeries3.YBindingPath = "Visitors";
stackingColumnSeries3.GroupingLabel = "GroupOne";
stackingColumnSeries3.Label = "Yahoo";
chart.Series.Add(stackingColumnSeries3);

StackingColumnSeries stackingColumnSeries4 = new StackingColumnSeries();
stackingColumnSeries4.ItemsSource = Data4;
stackingColumnSeries4.XBindingPath = "Year";
stackingColumnSeries4.YBindingPath = "Visitors";
stackingColumnSeries4.GroupingLabel = "GroupTwo";
stackingColumnSeries4.Label = "Ask";
chart.Series.Add(stackingColumnSeries4);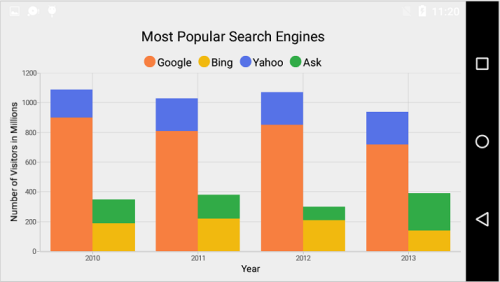
Animation
SfChart provides animation support for data series. Series will be animated whenever the ItemsSource changes. Animation can be enabled by using the EnableAnimation property. You can also control the duration of the animation using AnimationDuration property.
[C#]

ColumnSeries columnSeries = new ColumnSeries();

columnSeries.ItemsSource = dataPoints;

columnSeries.XBindingPath = "XValue";

columnSeries.YBindingPath = "YValue";

columnSeries.EnableAnimation = true;

columnSeries.AnimationDuration = 2;
Transpose the Series (Vertical Chart)
The Transposed property of CartesianSeries is used to plot the chart vertically and view the data in a different perspective.
[C#]

SfChart chart = new SfChart();
...

LineSeries lineSeries = new LineSeries();

lineSeries.Transposed = true;

chart.Series.Add(lineSeries);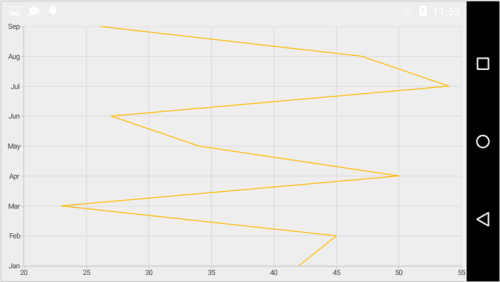
Methods
The following methods are available in ChartSeries
-
FindNearestChartPoint(float pointX,float pointY)- Gets the nearest data point for a particular touch point. -
FindNearestChartPoints(float pointX,float pointY)- Gets the list of nearest data points for a particular touch point. -
CreateSegment()andCreateSegments()- Overriding these methods, we can customize the rendering of segments. -
Animate()- Animate is a built-in method and a short way to play animation on a chart series.
Adding separate view for series
The SeriesRenderer view is used to render ChartSeries using the GetView method. The following code sample demonstrates how to add a separate view for series.
[C#]

public class CustomColumnSeries : ColumnSeries
{
    SeriesRenderer view = new SeriesRenderer(Android.App.Application.Context);
    protected override SeriesRenderer GetView()
    {
        return view;
    }
}