How can I help you?
Appearance in Xamarin.Android Chart(SfChart)
25 Nov 202210 minutes to read
Apply palette for Series
ColorModel property of SfChart is used to define the colors for each series. ColorModel contains the following color palettes.
Predefined Palettes
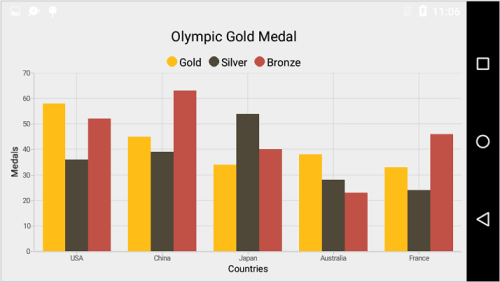
Currently, Chart supports three types of palette and Metro palette is the default palette for SfChart.
These predefined palettes are
- Metro
- Pineapple
- TomatoSpectrum
The following screenshot shows the default appearance of multiple series.
Custom Palette
You can apply the custom colors by setting the palette as Custom using ColorPalette and provide the custom colors using CustomColors property.
Following code illustrates how to set the custom colors.
[C#]

SfChart chart = new SfChart(this);
...

var colors = new List<Color>();
colors.Add(Color.ParseColor("#FFEAE018"));
colors.Add(Color.ParseColor("#FFB3B1AD"));
colors.Add(Color.ParseColor("#FF8C0707"));

chart.ColorModel.ColorPalette = ChartColorPalette.Custom;
chart.ColorModel.CustomColors = colors;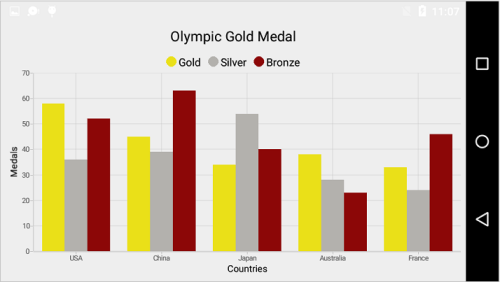
None Palette
None palette will not apply any color to the series. So in order to define the color for any series, you can use the Color property or the ColorModel property of ChartSeries (The ColorModel of Series will be explained later in this document).
Apply palette for data points
ColorModel property of ChartSeries is used to define the colors for each data point. Following palettes are used to define the colors.
Predefined Palettes
Currently, Chart supports three types of palette. These predefined palettes are
- Metro
- Pineapple
- TomatoSpectrum
[C#]

ColumnSeries columnSeries = new ColumnSeries();
columnSeries.ColorModel.ColorPalette = ChartColorPalette.Metro;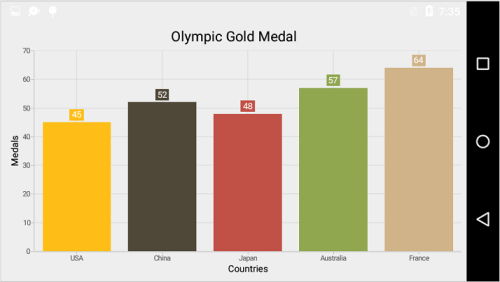
Custom Palette
You can apply the custom colors by setting the palette as Custom using ColorPalette and provide the custom colors using CustomColors property.
Following code illustrates how to set the custom colors.
[C#]

var colors = new List<Color>();
colors.Add(Color.Red);
colors.Add(Color.Gray);
colors.Add(Color.Blue);
colors.Add(Color.Maroon);
colors.Add(Color.Pink);

ColumnSeries columnSeries = new ColumnSeries();
columnSeries.ColorModel.ColorPalette = ChartColorPalette.Custom;
columnSeries.ColorModel.CustomColors = colors;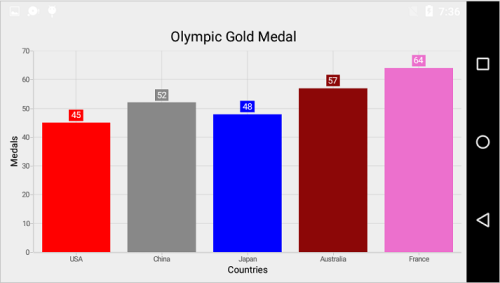
None Palette
None palette will not apply any color to the data points. So in order to define the color for the data points, you can use the Color property of ChartSeries.
Gradient Colors
The CustomGradientColors property of ChartColorModel is used to define the gradient colors, the colors from this property is used for series or chart if the Palette property of ChartColorModel is Custom and the CustomColors property is null. The following properties are used to define the gradient color for the chart.
The StartPoint and EndPoint properties of ChartGradientColor is used to configure the direction of gradient color, GradientStops property is used to set the color based on the offset.
The Color and Offset properties of ChartGradientStop is used to configure the color and offset position of each color.
Following code snippets and screenshot illustrates how to apply the gradient color to the chart series.
[C#]

            series.ColorModel.ColorPalette = ChartColorPalette.Custom;

            ChartGradientColor gradientColor1 = new ChartGradientColor() { StartPoint = new PointF(0.5f, 1), EndPoint = new PointF(0.5f, 0) };
            ChartGradientStop stop11 = new ChartGradientStop() { Color = Color.ParseColor("#FFE7C7"), Offset = 0 };
            ChartGradientStop stop12 = new ChartGradientStop() { Color = Color.ParseColor("#FCB69F"), Offset = 1 };
            gradientColor1.GradientStops.Add(stop11);
            gradientColor1.GradientStops.Add(stop12);

            ChartGradientColor gradientColor2 = new ChartGradientColor() { StartPoint = new PointF(0.5f, 1), EndPoint = new PointF(0.5f, 0) };
            ChartGradientStop stop21 = new ChartGradientStop() { Color = Color.ParseColor("#DCFA97"), Offset = 0 };
            ChartGradientStop stop22 = new ChartGradientStop() { Color = Color.ParseColor("#96E6A1"), Offset = 1 };
            gradientColor2.GradientStops.Add(stop21);
            gradientColor2.GradientStops.Add(stop22);

            ChartGradientColor gradientColor3 = new ChartGradientColor() { StartPoint = new PointF(0.5f, 1), EndPoint = new PointF(0.5f, 0) };
            ChartGradientStop stop31 = new ChartGradientStop() { Color = Color.ParseColor("#DDD6F3"), Offset = 0 };
            ChartGradientStop stop32 = new ChartGradientStop() { Color = Color.ParseColor("#FAACA8"), Offset = 1 };
            gradientColor3.GradientStops.Add(stop31);
            gradientColor3.GradientStops.Add(stop32);

            ChartGradientColor gradientColor4 = new ChartGradientColor() { StartPoint = new PointF(0.5f, 1), EndPoint = new PointF(0.5f, 0) };
            ChartGradientStop stop41 = new ChartGradientStop() { Color = Color.ParseColor("#A8EAEE"), Offset = 0 };
            ChartGradientStop stop42 = new ChartGradientStop() { Color = Color.ParseColor("#7BB0F9"), Offset = 1 };
            gradientColor4.GradientStops.Add(stop41);
            gradientColor4.GradientStops.Add(stop42);

            ChartGradientColorCollection gradientColors = new ChartGradientColorCollection()
            {
                gradientColor1,
                gradientColor2,
                gradientColor3,
                gradientColor4
            };

        series.ColorModel.CustomGradientColors = gradientColors;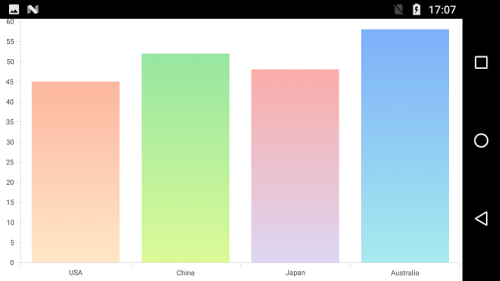
Following code snippet and screenshot illustrates how to apply the gradient color to the chart area.
[C#]

           chart.ColorModel.ColorPalette = ChartColorPalette.Custom;

            ChartGradientColor gradientColor = new ChartGradientColor() { StartPoint = new PointF(0.5f, 1), EndPoint = new PointF(0.5f, 0) };
            ChartGradientStop stop1 = new ChartGradientStop() { Color = Color.ParseColor("#FFE7C7"), Offset = 0 };
            ChartGradientStop stop2 = new ChartGradientStop() { Color = Color.ParseColor("#FCB69F"), Offset = 1 };
            gradientColor.GradientStops.Add(stop1);
            gradientColor.GradientStops.Add(stop2);

             ChartGradientColorCollection gradientColors = new ChartGradientColorCollection()
            {
                gradientColor
            };

            chart.ColorModel.CustomGradientColors = gradientColors;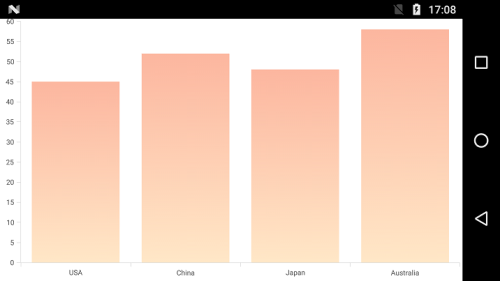
Plotting Area Customization
SfChart provides the AreaBorderColor, AreaBorderWidth, and AreaBackgroundColor properties to customize the plot area.
The following code samples demonstrate the usage of these properties:
[C#]

SfChart chart = new SfChart();
chart.AreaBackgroundColor = Color.Cyan;
chart.AreaBorderColor = Color.Gray;
chart.AreaBorderWidth = 3;
Methods
The following methods are available in chart to get the brushes
-
GetColor(int colorIndex)- Returns the brush at the specified index for current palette. -
GetColors(ChartColorPalette palette)- Returns a collection of brushes for specified palette.