Getting Started of Xamarin.Android Chart(SfChart)
25 Nov 20249 minutes to read
This section explains you the steps required to populate the Chart with data, title, add data labels and tooltips to the Chart. This section covers only the minimal features that you need to know to get started with the Chart.
Adding Chart Reference
After installing Essential Studio® for Xamarin, you can find all the required assemblies in the installation folders,
{Syncfusion Installed location}\Essential Studio\15.3.0.26\lib
NOTE
Assemblies are available in unzipped package location in Mac.
Add the following assembly references to the Android project,
android\Syncfusion.SfChart.Android.dll
IMPORTANT
Starting with v16.2.0.x, if you reference Syncfusion assemblies from trial setup or from the NuGet feed, you also have to include a license key in your projects. Please refer to this
linkto know about registering Syncfusion license key in your Xamarin application to use our components.
Initialize Chart
You can add SfChart to the Xamarin.Android designer from toolbox and customize some basic properties from the property window.
You can get the chart instance from axml page in MainActivity using the following code.
SfChart chart = FindViewById<SfChart>(Resource.Id.sfChart1);You can create chart using code behind also. The following steps help to add chart using code behind.
Import the SfChart namespace as shown below in your respective Page,
using Com.Syncfusion.Charts;Then initialize an empty chart with PrimaryAxis and SecondaryAxis as shown below,
SfChart chart = new SfChart (this);
//Initializing Primary Axis
CategoryAxis primaryAxis = new CategoryAxis ();
chart.PrimaryAxis = primaryAxis;
//Initializing Secondary Axis
NumericalAxis secondaryAxis = new NumericalAxis ();
chart.SecondaryAxis = secondaryAxis;
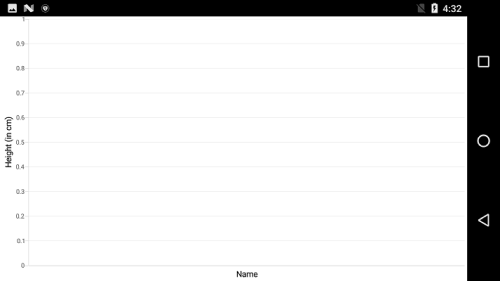
SetContentView(chart);Run the project and check if you get following output to make sure you have configured your project properly to add SfChart.
Populate Chart with data
To visualize the comparison of person heights in chart data, create an instance of ColumnSeries, add it to the Series collection property of SfChart, and then set the actual Data collection to the ItemsSource property of ChartSeries as demonstrated in the following code snippet.
NOTE
You need to get the
NameandHeightvalues inDatacollection to theColumnSeriesby settingXBindingPathandYBindingPathwith the respective field names to plot the series.
//Initializing primary axis
CategoryAxis primaryAxis = new CategoryAxis();

primaryAxis.Title.Text = "Name";

chart.PrimaryAxis = primaryAxis;

//Initializing secondary Axis
NumericalAxis secondaryAxis = new NumericalAxis();

secondaryAxis.Title.Text = "Height (in cm)";

chart.SecondaryAxis = secondaryAxis;

ObservableCollection<ChartData> Data = new ObservableCollection<ChartData>()
{
    new ChartData { Name = "David", Height = 180 },
    new ChartData { Name = "Michael", Height = 170 },
    new ChartData { Name = "Steve", Height = 160 },
    new ChartData { Name = "Joel", Height = 182 }
};

//Initializing column series
ColumnSeries series = new ColumnSeries();

series.ItemsSource = Data;

series.XBindingPath = "Name";

series.YBindingPath = "Height";

chart.Series.Add(series);public class ChartData
{
public string Name { get; set; }
public double Height { get; set; }
}Add Title
You can add title to chart to provide quick information to the user about the data being plotted in the chart. You can set title using SfChart.Title property as shown below.
chart.Title.Text = "Chart";Refer this link to learn more about the options available in SfChart to customize chart title.
Enable data labels
You can add data labels to improve the readability of the chart. This can be achieved using ChartSeries.DataMarker.ShowLabel property as shown below.
series.DataMarker.ShowLabel = true;Refer this link to learn more about the options available in SfChart to customize data markers.
Enable legend
You can enable legend using SfChart.Legend property as shown below,
chart.Legend.Visibility = Visibility.Visible;Additionally, you need to set label for each series using ChartSeries.Label property, which will be displayed in corresponding legend.
series.Label = "Heights";Refer this link to learn more about the options available in SfChart to customize legend.
Enable tooltip
Tooltips are used to show information about the segment, when you tap on the segment. You can enable tooltip by setting ChartSeries.TooltipEnabled property to true.
series.TooltipEnabled = true;Refer this link to learn more about the options available in SfChart to customize tooltip.
The following code example gives you the complete code of above configurations.
using Com.Syncfusion.Charts;
namespace Chart_GettingStarted
{
[Activity( MainLauncher = true, Icon = "@drawable/icon")]
public class MainActivity : Activity
{
protected override void OnCreate(Bundle bundle)
{
base.OnCreate(bundle);
SfChart chart = new SfChart(this);
chart.Title.Text = "Chart";
chart.SetBackgroundColor(Color.White);
//Initializing primary axis
CategoryAxis primaryAxis = new CategoryAxis();
primaryAxis.Title.Text = "Name";
chart.PrimaryAxis = primaryAxis;
//Initializing secondary Axis
NumericalAxis secondaryAxis = new NumericalAxis();
secondaryAxis.Title.Text = "Height (in cm)";
chart.SecondaryAxis = secondaryAxis;
ObservableCollection<ChartData> data = new ObservableCollection<ChartData>()
{
new ChartData { Name = "David", Height = 180 },
new ChartData { Name = "Michael", Height = 170 },
new ChartData { Name = "Steve", Height = 160 },
new ChartData { Name = "Joel", Height = 182 }
};
//Initializing column series
ColumnSeries series = new ColumnSeries();
series.ItemsSource = data;
series.XBindingPath = "Name";
series.YBindingPath = "Height";
series.DataMarker.ShowLabel = true;
series.Label = "Heights";
series.TooltipEnabled = true;
chart.Series.Add(series);
chart.Legend.Visibility = Visibility.Visible;
SetContentView(chart);
}
}
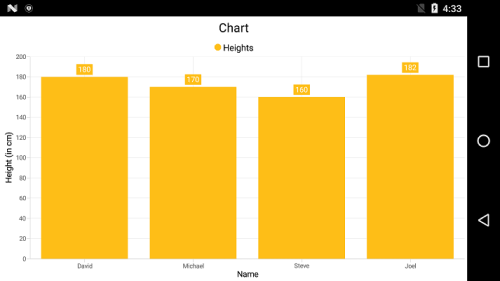
}The following chart is created as a result of the above codes.
You can find the complete getting started sample from this link.