Surface Area in WPF Surface Chart (SfSurfaceChart)
10 Jul 20264 minutes to read
The surface area represents the entire surface chart and all its elements. It is a virtual rectangular area that includes all the surface elements like axis, color bar, wall, etc.
The surface chart can be customized to enrich your application’s look and feel. SfSurfaceChart provides APIs to customize the surface area based on your requirement. This section explains the elements and APIs for common customization of the surface area.
Properties
| Name | Description |
|---|---|
|
|
Gets or sets a bool value that enables rotation for the surface chart. |
|
|
Gets or sets the double value that represents a rotation value for surface chart. |
|
|
Gets or sets the double value that represents a tilt value for surface chart. |
|
|
Gets or sets the value that represents type of camera projection in surface chart. |
|
|
Gets or sets the object that represents the content of a surface header. This property is used to specify any object as Header for surface chart. |
|
|
Gets or sets a brush for left wall. |
|
|
Gets or sets a brush for bottom wall. |
|
|
Gets or sets a brush for back wall. |
|
|
Gets or sets the wall thickness for surface chart. |
|
|
Gets or sets the double value that represents wireframe stroke thickness. |
|
|
Gets or sets a brush for wireframe stroke. |
|
|
Gets or sets the color palette for the surface chart. |
|
|
Gets or sets double value that represent the zoom level value for surface chart. |
|
|
Gets or sets type for choosing surface chart type. |
|
|
Gets or sets the X-Axis for the surface chart. |
|
|
Gets or sets the Y-Axis for the surface chart. |
|
|
Gets or sets the Z-Axis for the surface chart. |
|
|
Gets or sets items source for surface chart. |
|
|
Gets or sets a string that represents the X member path value of items source. |
|
|
Gets or sets a string that represents the Y member path value of items source. |
|
|
Gets or sets a string that represents the Z member path value of items source. |
|
|
Gets or sets color bar for surface chart. |
|
|
Gets or sets the bool value that represents a value for applying the gradient brush in surface chart. |
|
|
Gets or sets the bool value that represents a value to enable zooming in surface chart. |
|
|
Gets or sets the bool value that represents a value whether to show the contour line for surface chart. |
|
|
Gets or sets the double value that represents a value of brush count in surface chart. |
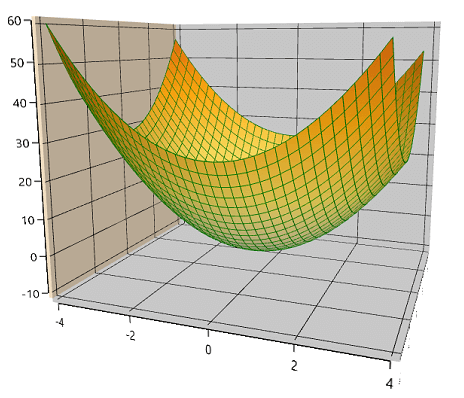
The following code sample explains the customization of surface area.
<chart:SfSurfaceChart ItemsSource="{Binding DataValues}"  XBindingPath="X"  Type="WireframeSurface"
                              YBindingPath="Y" ZBindingPath="Z" RowSize="{Binding RowSize}"
                              ColumnSize="{Binding ColumnSize}" ApplyGradientBrush="True" BrushCount="4"
                              LeftWallBrush="BlanchedAlmond" WireframeStroke="Green" WireframeStrokeThickness="1"
                              CameraProjection="Perspective" Tilt="10" Rotate="20">
            </chart:SfSurfaceChart>
SfSurfaceChart chart = new SfSurfaceChart();
chart.Type = SurfaceType.WireframeSurface;
chart.SetBinding(SfSurfaceChart.ItemsSourceProperty, "DataValues");
chart.SetBinding(SfSurfaceChart.RowSizeProperty, "RowSize");
chart.SetBinding(SfSurfaceChart.ColumnSizeProperty, "ColumnSize");
chart.XBindingPath = "X";
chart.YBindingPath = "Y";
chart.ZBindingPath = "Z";
chart.BrushCount = 4;
chart.LeftWallBrush = new SolidColorBrush(Colors.BlanchedAlmond);
chart.WireframeStroke = new SolidColorBrush(Colors.Green);
chart.WireframeStrokeThickness = 1;
chart.CameraProjection = CameraProjection.Perspective;
chart.Tilt = 10;
chart.Rotate = 20;
grid.Children.Add(chart);