Getting Started with WPF Surface Chart (SfSurfaceChart)
10 Jul 202616 minutes to read
This section helps you get started with SfSurfaceChart control.
Visual Structure
The following image helps you understand various elements in SfSurfaceChart when you use it for the first time.
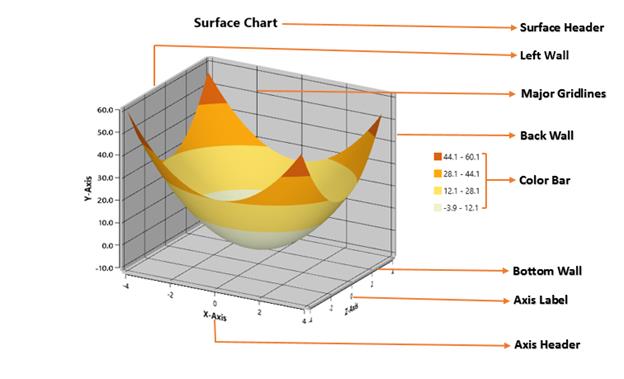
- Surface Header - Represents the title of the surface chart.
- Wall - Represents the wall that bounds the surface chart.
- Major Gridlines - Represents the surface axis gridline for the surface chart.
- Color Bar - Displays the value range in color for the surface chart.
- Axis Label - Displays the label for the surface axis.
- Axis Header - Displays the header of the surface axis.
Create a simple surface chart from XAML
This section demonstrates how to create a surface chart using the SfSurfaceChart control from XAML. You can add the SfChart assembly as a reference to your application to create a surface chart using the SfSurfaceChart control from XAML.
Add Assembly reference
- Open the Add Reference window from your project.
- Choose Windows > Extensions > Syncfusion.SfChart.WPF.
-
Add the following namespace in your XAML page.
- XAML
xmlns:syncfusion="clr-namespace:Syncfusion.UI.Xaml.Charts;assembly=Syncfusion.SfChart.WPF"NOTE
Adding the extension Syncfusion.SfChart.WPF, adds all the Syncfusion WPF controls. You can also add the SfChart reference alone from the following location. C:\Program Files (x86)\Syncfusion\Essential Studio
\Assemblies (4.0/4.5.1/4.6)
Initialize the surface chart
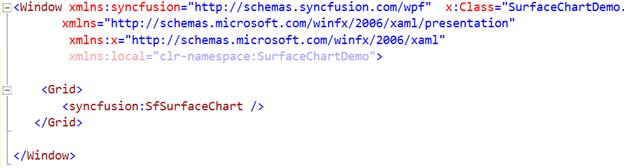
You need to initialize the surface chart from the Syncfusion.UI.Xaml.Charts namespace.
<syncfusion:SfSurfaceChart>

       </syncfusion:SfSurfaceChart>
Add Surface chart from Toolbox
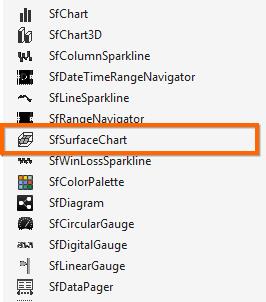
Drag the SfSurfaceChart control from the Toolbox to the required location, where the surface chart should be displayed. You can select Toolbox from the View menu, when the toolbox window is not available in the project. The Toolbox window appears on the left side of the screen.
The Syncfusion WPF reference is added to the application reference and the xmlns namespace is added to MainPage.xaml.

The following dataset is used to plot the surface chart.
| X | 0 | 0 | 0 | 1 | 1 | 1 | 2 | 2 | 2 |
|---|---|---|---|---|---|---|---|---|---|
| Y | 3 | 2 | 1 | 2 | 1 | 2 | 1 | 2 | 3 |
| Z | 0 | 1 | 2 | 0 | 1 | 2 | 0 | 1 | 2 |
Before proceeding with the chart, create a data model with the above details as follows.
public class Data
{
	public double X { get; set; }
	public double Y { get; set; }
	public double Z { get; set; }
}
Now, you have a data model property that holds the values of each item in the collection.
public ObservableCollection<Data> DataValues { get; set; }Additionally, you have properties for the row and column size of the given data.
public int RowSize { get; set; }

public int ColumnSize { get; set; }
Add the values to the above-defined collection property called DataValues, with the values illustrated in the above table.
DataValues.Add(new Data() {X = 0, Y = 3, Z = 0});
DataValues.Add(new Data() {X = 0, Y = 2, Z = 1});
DataValues.Add(new Data() {X = 0, Y = 1, Z = 2});

DataValues.Add(new Data() { X = 1, Y = 2, Z = 0 });
DataValues.Add(new Data() { X = 1, Y = 1, Z = 1 });
DataValues.Add(new Data() { X = 1, Y = 2, Z = 2 });

DataValues.Add(new Data() { X = 2, Y = 1, Z = 0 });
DataValues.Add(new Data() { X = 2, Y = 2, Z = 1 });
DataValues.Add(new Data() { X = 2, Y = 3, Z = 2 });

RowSize = 3;
ColumnSize = 3;
Now, you can add the required elements to the created surface instance.
Add data to the surface chart
After you populate the data to the chart, you can bind the properties as shown in the following code example.
<syncfusion:SfSurfaceChart ItemsSource="{Binding DataValues}"  XBindingPath="X"

                 YBindingPath="Y" ZBindingPath="Z"

                 RowSize="{Binding RowSize}"

                 ColumnSize="{Binding ColumnSize}" >
Add a header to the surface chart
The header acts as the title of the created surface chart, to identify its purpose.
<syncfusion:SfSurfaceChart Header="Simple Surface" FontSize="20" />Add axes to the surface chart
The following code example illustrates how to add the XAxis, YAxis, and ZAxis to the surface chart.
<syncfusion:SfSurfaceChart ItemsSource="{Binding DataValues}"  XBindingPath="X"
                              YBindingPath="Y" ZBindingPath="Z" RowSize="{Binding RowSize}"
                              ColumnSize="{Binding ColumnSize}">

            <syncfusion:SfSurfaceChart.XAxis>

                <syncfusion:SurfaceAxis Header="X-Axis" />

            </syncfusion:SfSurfaceChart.XAxis>

            <syncfusion:SfSurfaceChart.YAxis>

                <syncfusion:SurfaceAxis Header="Y-Axis" LabelFormat="0.0"/>

            </syncfusion:SfSurfaceChart.YAxis>

            <syncfusion:SfSurfaceChart.ZAxis>

                <syncfusion:SurfaceAxis Header="Z-Axis"/>

            </syncfusion:SfSurfaceChart.ZAxis>

        </syncfusion:SfSurfaceChart>
NOTE
SfSurfaceChart supports default axes; all the axes are generated automatically, even when they have not been defined explicitly.
Add surface type
The following code example illustrates how to add the surface type to the surface chart.
<syncfusion:SfSurfaceChart Type="Surface" />Add color bar to the surface chart
The following code example illustrates how to add a color bar to the surface chart.
<syncfusion:SfSurfaceChart.ColorBar>
                <syncfusion:ChartColorBar ShowLabel="True" DockPosition="Right"/>
         </syncfusion:SfSurfaceChart.ColorBar>
Now, you have created a simple surface chart. The following is the complete XAML code example.
<syncfusion:SfSurfaceChart Type="Surface" Tilt="15" Rotate="30"
ItemsSource="{Binding DataValues}" XBindingPath="X"
YBindingPath="Y" ZBindingPath="Z"
RowSize="{Binding RowSize}"
ColumnSize="{Binding ColumnSize}">
<syncfusion:SfSurfaceChart.XAxis>
<syncfusion:SurfaceAxis Header="X-Axis" />
</syncfusion:SfSurfaceChart.XAxis>
<syncfusion:SfSurfaceChart.YAxis>
<syncfusion:SurfaceAxis Header="Y-Axis" LabelFormat="0.0"/>
</syncfusion:SfSurfaceChart.YAxis>
<syncfusion:SfSurfaceChart.ZAxis>
<syncfusion:SurfaceAxis Header="Z-Axis"/>
</syncfusion:SfSurfaceChart.ZAxis>
<syncfusion:SfSurfaceChart.ColorBar>
<syncfusion:ChartColorBar DockPosition="Right"/>
</syncfusion:SfSurfaceChart.ColorBar>
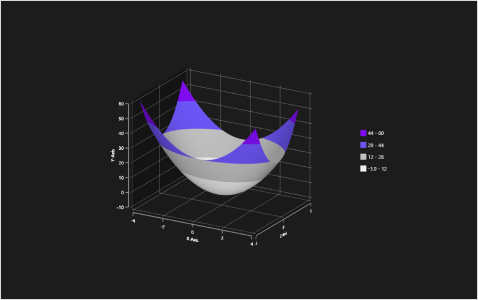
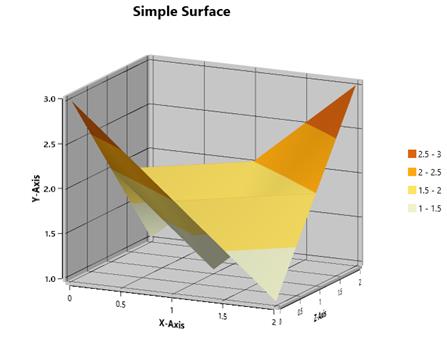
</syncfusion:SfSurfaceChart>The following output is displayed as a result of the above code example.
Create a simple surface chart from code behind
This section demonstrates how to create a surface chart using the SfSurfaceChart control from code behind. For that, you can add the SfChart assembly reference to your application.
Add Assembly reference
- Open the Add Reference window from your project.
- Choose Windows > Extensions >Syncfusion.SfChart.WPF.
-
Add the following namespace in code behind.
- C#
using Syncfusion.UI.Xaml.Charts;The following section demonstrates how to create a simple surface chart using the data discussed in the above table.
Initialize the surface chart
SfSurfaceChart surface = new SfSurfaceChart();Add data to the surface chart
You can set the surface chart data in code behind by directly adding data points to the Data property of the surface chart using the AddPoints(x, y, z) method, as shown in the following code example.
SfSurfaceChart surface = new SfSurfaceChart();

//First Row
surface.Data.AddPoints(0, 3, 0);
surface.Data.AddPoints(0, 2, 1);
surface.Data.AddPoints(0, 2, 2);

//Second Row
surface.Data.AddPoints(1, 2, 0);
surface.Data.AddPoints(1, 1, 1);
surface.Data.AddPoints(1, 2, 2);

//Third Row
surface.Data.AddPoints(2, 1, 0);
surface.Data.AddPoints(2, 2, 1);
surface.Data.AddPoints(2, 3, 2);

surface.RowSize = 3;
surface.ColumnSize = 3;
grid.Children.Add(surface);
Add a header to the surface chart
The header acts as the title of the created surface chart, to identify its purpose.
SfSurfaceChart chart = new SfSurfaceChart();
chart.Header = "Simple Surface";
chart.FontSize = 20;
grid.Children.Add(chart);
Add axes to the surface chart
The following code example illustrates how to add the XAxis, YAxis, and ZAxis to the surface chart.
SfSurfaceChart chart = new SfSurfaceChart();
chart.SetBinding(SfSurfaceChart.ItemsSourceProperty, "DataValues");
chart.SetBinding(SfSurfaceChart.RowSizeProperty, "RowSize");
chart.SetBinding(SfSurfaceChart.ColumnSizeProperty, "ColumnSize");
chart.XBindingPath = "X";
chart.YBindingPath = "Y";
chart.ZBindingPath = "Z";

// Add X axis to surface
SurfaceAxis xAxis = new SurfaceAxis();
xAxis.Header = "X-Axis";
chart.XAxis = xAxis;

// Add Y axis to surface
SurfaceAxis yAxis = new SurfaceAxis();
yAxis.Header = "Y-Axis";
yAxis.LabelFormat = "0.0";
chart.YAxis = yAxis;

// Add Z axis to surface
SurfaceAxis zAxis = new SurfaceAxis();
zAxis.Header = "Z-Axis";
chart.ZAxis = zAxis;
grid.Children.Add(chart);
NOTE
SfSurfaceChart supports default axes, where all the axes are generated automatically, even when they are not defined explicitly.
Add surface type
The following code example illustrates how to add the surface type to the surface chart.
SfSurfaceChart chart = new SfSurfaceChart();
chart.Type = SurfaceType.Surface;
grid.Children.Add(chart);
Add color bar to the surface chart
The following code example illustrates how to add a color bar to the surface chart.
ChartColorBar colorBar = new ChartColorBar();
colorBar.DockPosition = ChartDock.Right;
colorBar.ShowLabel = true;
chart.ColorBar = colorBar;
Now, you have created a simple surface chart from code behind. Data can be populated either by using the ItemsSource property or by using the AddPoints method of the Data property of the surface chart.
Populate data using the ItemsSource property
SfSurfaceChart chart = new SfSurfaceChart();
chart.SetBinding(SfSurfaceChart.ItemsSourceProperty, "DataValues");
chart.SetBinding(SfSurfaceChart.RowSizeProperty, "RowSize");
chart.SetBinding(SfSurfaceChart.ColumnSizeProperty, "ColumnSize");
chart.XBindingPath = "X";
chart.YBindingPath = "Y";
chart.ZBindingPath = "Z";
grid.Children.Add(chart);
Populate data using the AddPoints method
SfSurfaceChart surface = new SfSurfaceChart();
surface.Header = "Simple Surface";
surface.Tilt = 15;
surface.Rotate = 30;
surface.Type = SurfaceType.Surface;

// First Row
surface.Data.AddPoints(0, 3, 0);
surface.Data.AddPoints(0, 2, 1);
surface.Data.AddPoints(0, 2, 2);

// Second Row
surface.Data.AddPoints(1, 2, 0);
surface.Data.AddPoints(1, 1, 1);
surface.Data.AddPoints(1, 2, 2);

// Third Row
surface.Data.AddPoints(2, 1, 0);
surface.Data.AddPoints(2, 2, 1);
surface.Data.AddPoints(2, 3, 2);

surface.RowSize = 3;
surface.ColumnSize = 3;

// Add X axis to surface
SurfaceAxis xAxis = new SurfaceAxis();
xAxis.Header = "X-Axis";
surface.XAxis = xAxis;

// Add Y axis to surface
SurfaceAxis yAxis = new SurfaceAxis();
yAxis.Header = "Y-Axis";
yAxis.LabelFormat = "0.0";
surface.YAxis = yAxis;

// Add Z axis to surface
SurfaceAxis zAxis = new SurfaceAxis();
zAxis.Header = "Z-Axis";
surface.ZAxis = zAxis;

ChartColorBar colorBar = new ChartColorBar();
colorBar.DockPosition = ChartDock.Right;
colorBar.ShowLabel = true;
surface.ColorBar = colorBar;
this.Content = surface;
The following output is displayed as a result of the above code example.
You can get the complete getting started sample here.

Theme
WPF SurfaceChart (SfSurfaceChart) supports various built-in themes. Refer to the following links to apply themes for the SfSurfaceChart: