Surface Axis in WPF Surface Chart (SfSurfaceChart)
10 Jul 20266 minutes to read
SurfaceAxis is used to locate a data point inside the surface area. On a surface, you require three axes to locate data points, such as the X-Axis, Y-Axis, and Z-Axis. You can define axes in a surface using the following code example. If you do not define the axes, then it automatically takes the default axis with default property values.
XAML:
<chart:SfSurfaceChart>

	<chart:SfSurfaceChart.XAxis>

		<chart:SurfaceAxis  />

	</chart:SfSurfaceChart.XAxis>

	<chart:SfSurfaceChart.YAxis>

		<chart:SurfaceAxis />

	</chart:SfSurfaceChart.YAxis>

	<chart:SfSurfaceChart.ZAxis>

		<chart:SurfaceAxis />

	</chart:SfSurfaceChart.ZAxis>

	<chart:SfSurfaceChart />
SfSurfaceChart surface = new SfSurfaceChart();
surface.XAxis = new SurfaceAxis();
surface.YAxis = new SurfaceAxis();
surface.ZAxis = new SurfaceAxis();Axis customization
The axes of the surface chart can be customized using the following properties.
The following APIs are used to customize the surface axis.
Properties
| Name | Definition |
|---|---|
|
|
Gets or sets the object that represents the content of a surface axis header. This property is used to specify any object as Header for surface axis. |
|
|
Gets or sets template for surface axis header. |
|
|
Gets or sets template for surface axis label. |
|
|
Gets or sets format for surface axis label. |
|
|
Gets or sets the double that represents the minimum value for the axis. |
|
|
Gets or sets the double that represents the maximum value for the axis. |
|
|
Gets or sets NumericalPadding that specifies how to render the surface in surface area. |
|
|
Gets or sets EdgeLabelsDrawingMode that specifies how to place edge axis label. |
|
|
Gets or sets the double that represents the interval between labels. |
|
|
Gets or sets the double that represents the small ticks per interval. |
|
|
Gets or sets the double that represents the axis tick line size. |
|
|
Gets or sets a bool that represents whether to display the axis grid lines. |
|
|
Gets or sets the brush for grid line stroke. |
|
|
Gets or sets the double for grid line thickness. |
|
|
Gets or sets the style for axis line. |
|
|
Gets or sets the style for axis major tick lines. |
|
|
Gets or sets the style for axis minor tick lines. |
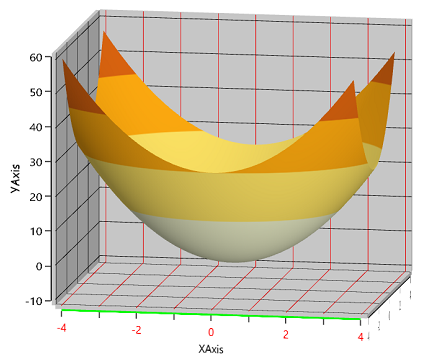
The following code snippet explains how to customize the axis using the above properties.
<Grid.Resources>
            <DataTemplate x:Key="labelTemplate">
                <TextBlock Text="{Binding LabelContent}" Foreground="Red"></TextBlock>
            </DataTemplate>

            <DataTemplate x:Key="headerTemplate">
                <TextBlock Text="YAxis" FontFamily="Comic Sans MS"></TextBlock>
            </DataTemplate>

            <Style TargetType="Line" x:Key="lineStyle">
                <Setter Property="Stroke" Value="Green"/>
                <Setter Property="StrokeThickness" Value="2"/>
            </Style>
        </Grid.Resources>


 	<chart:SfSurfaceChart ItemsSource="{Binding DataValues}"  XBindingPath="X"  Type="Surface"
                              YBindingPath="Y" ZBindingPath="Z" RowSize="{Binding RowSize}"
                              ColumnSize="{Binding ColumnSize}">

            <chart:SfSurfaceChart.XAxis>

                <chart:SurfaceAxis  GridLineStroke="Red" GridLineThickness="1"
                                   SmallTicksPerInterval="1" Header="XAxis" AxisLineStyle="{StaticResource lineStyle }"
                                    LabelTemplate="{StaticResource labelTemplate}">
                </chart:SurfaceAxis>

            </chart:SfSurfaceChart.XAxis>

            <chart:SfSurfaceChart.YAxis>
                <chart:SurfaceAxis HeaderTemplate="{StaticResource headerTemplate}" />
            </chart:SfSurfaceChart.YAxis>

            <chart:SfSurfaceChart.ZAxis>
                <chart:SurfaceAxis />
            </chart:SfSurfaceChart.ZAxis>

            </chart:SfSurfaceChart>
chart = new SfSurfaceChart();
chart.Type = SurfaceType.Surface;
chart.SetBinding(SfSurfaceChart.ItemsSourceProperty, "DataValues");
chart.SetBinding(SfSurfaceChart.RowSizeProperty, "RowSize");
chart.SetBinding(SfSurfaceChart.ColumnSizeProperty, "ColumnSize");
chart.XBindingPath = "X";
chart.YBindingPath = "Y";
chart.ZBindingPath = "Z";
SurfaceAxis xAxis = new SurfaceAxis();
xAxis.Header = "X-Axis";
chart.XAxis = xAxis;
xAxis.GridLineStroke = new SolidColorBrush(Colors.Red);
xAxis.GridLineThickness = 1;
xAxis.SmallTicksPerInterval = 1;
xAxis.AxisLineStyle = grid.Resources["lineStyle"] as Style;
xAxis.LabelTemplate = grid.Resources["labelTemplate"] as DataTemplate;
SurfaceAxis yAxis = new SurfaceAxis();
yAxis.Header = "Y-Axis";
chart.YAxis = yAxis;
yAxis.HeaderTemplate = grid.Resources["headerTemplate"] as DataTemplate;
SurfaceAxis zAxis = new SurfaceAxis();
zAxis.Header = "Z-Axis";
chart.ZAxis = zAxis;
grid.Children.Add(chart);